

Meritech Software Pulse | 06-March-2026
Thank you for reading the Meritech Software Pulse—a comprehensive analysis of the nearly $3 trillion public software industry. In this edition, we examine current market valuations, key operating metrics and KPIs, profitability trends across company stages, and the defining characteristics of best-in-class public software businesses. This is particularly important as the software market is rapidly changing in the world of AI.
For recurring updates delivered directly to your inbox, subscribe here.
1) Market Data - Updated Weekly
Top 10 Share Price Performances
The table below shows the top 10 share price increases over various time periods.
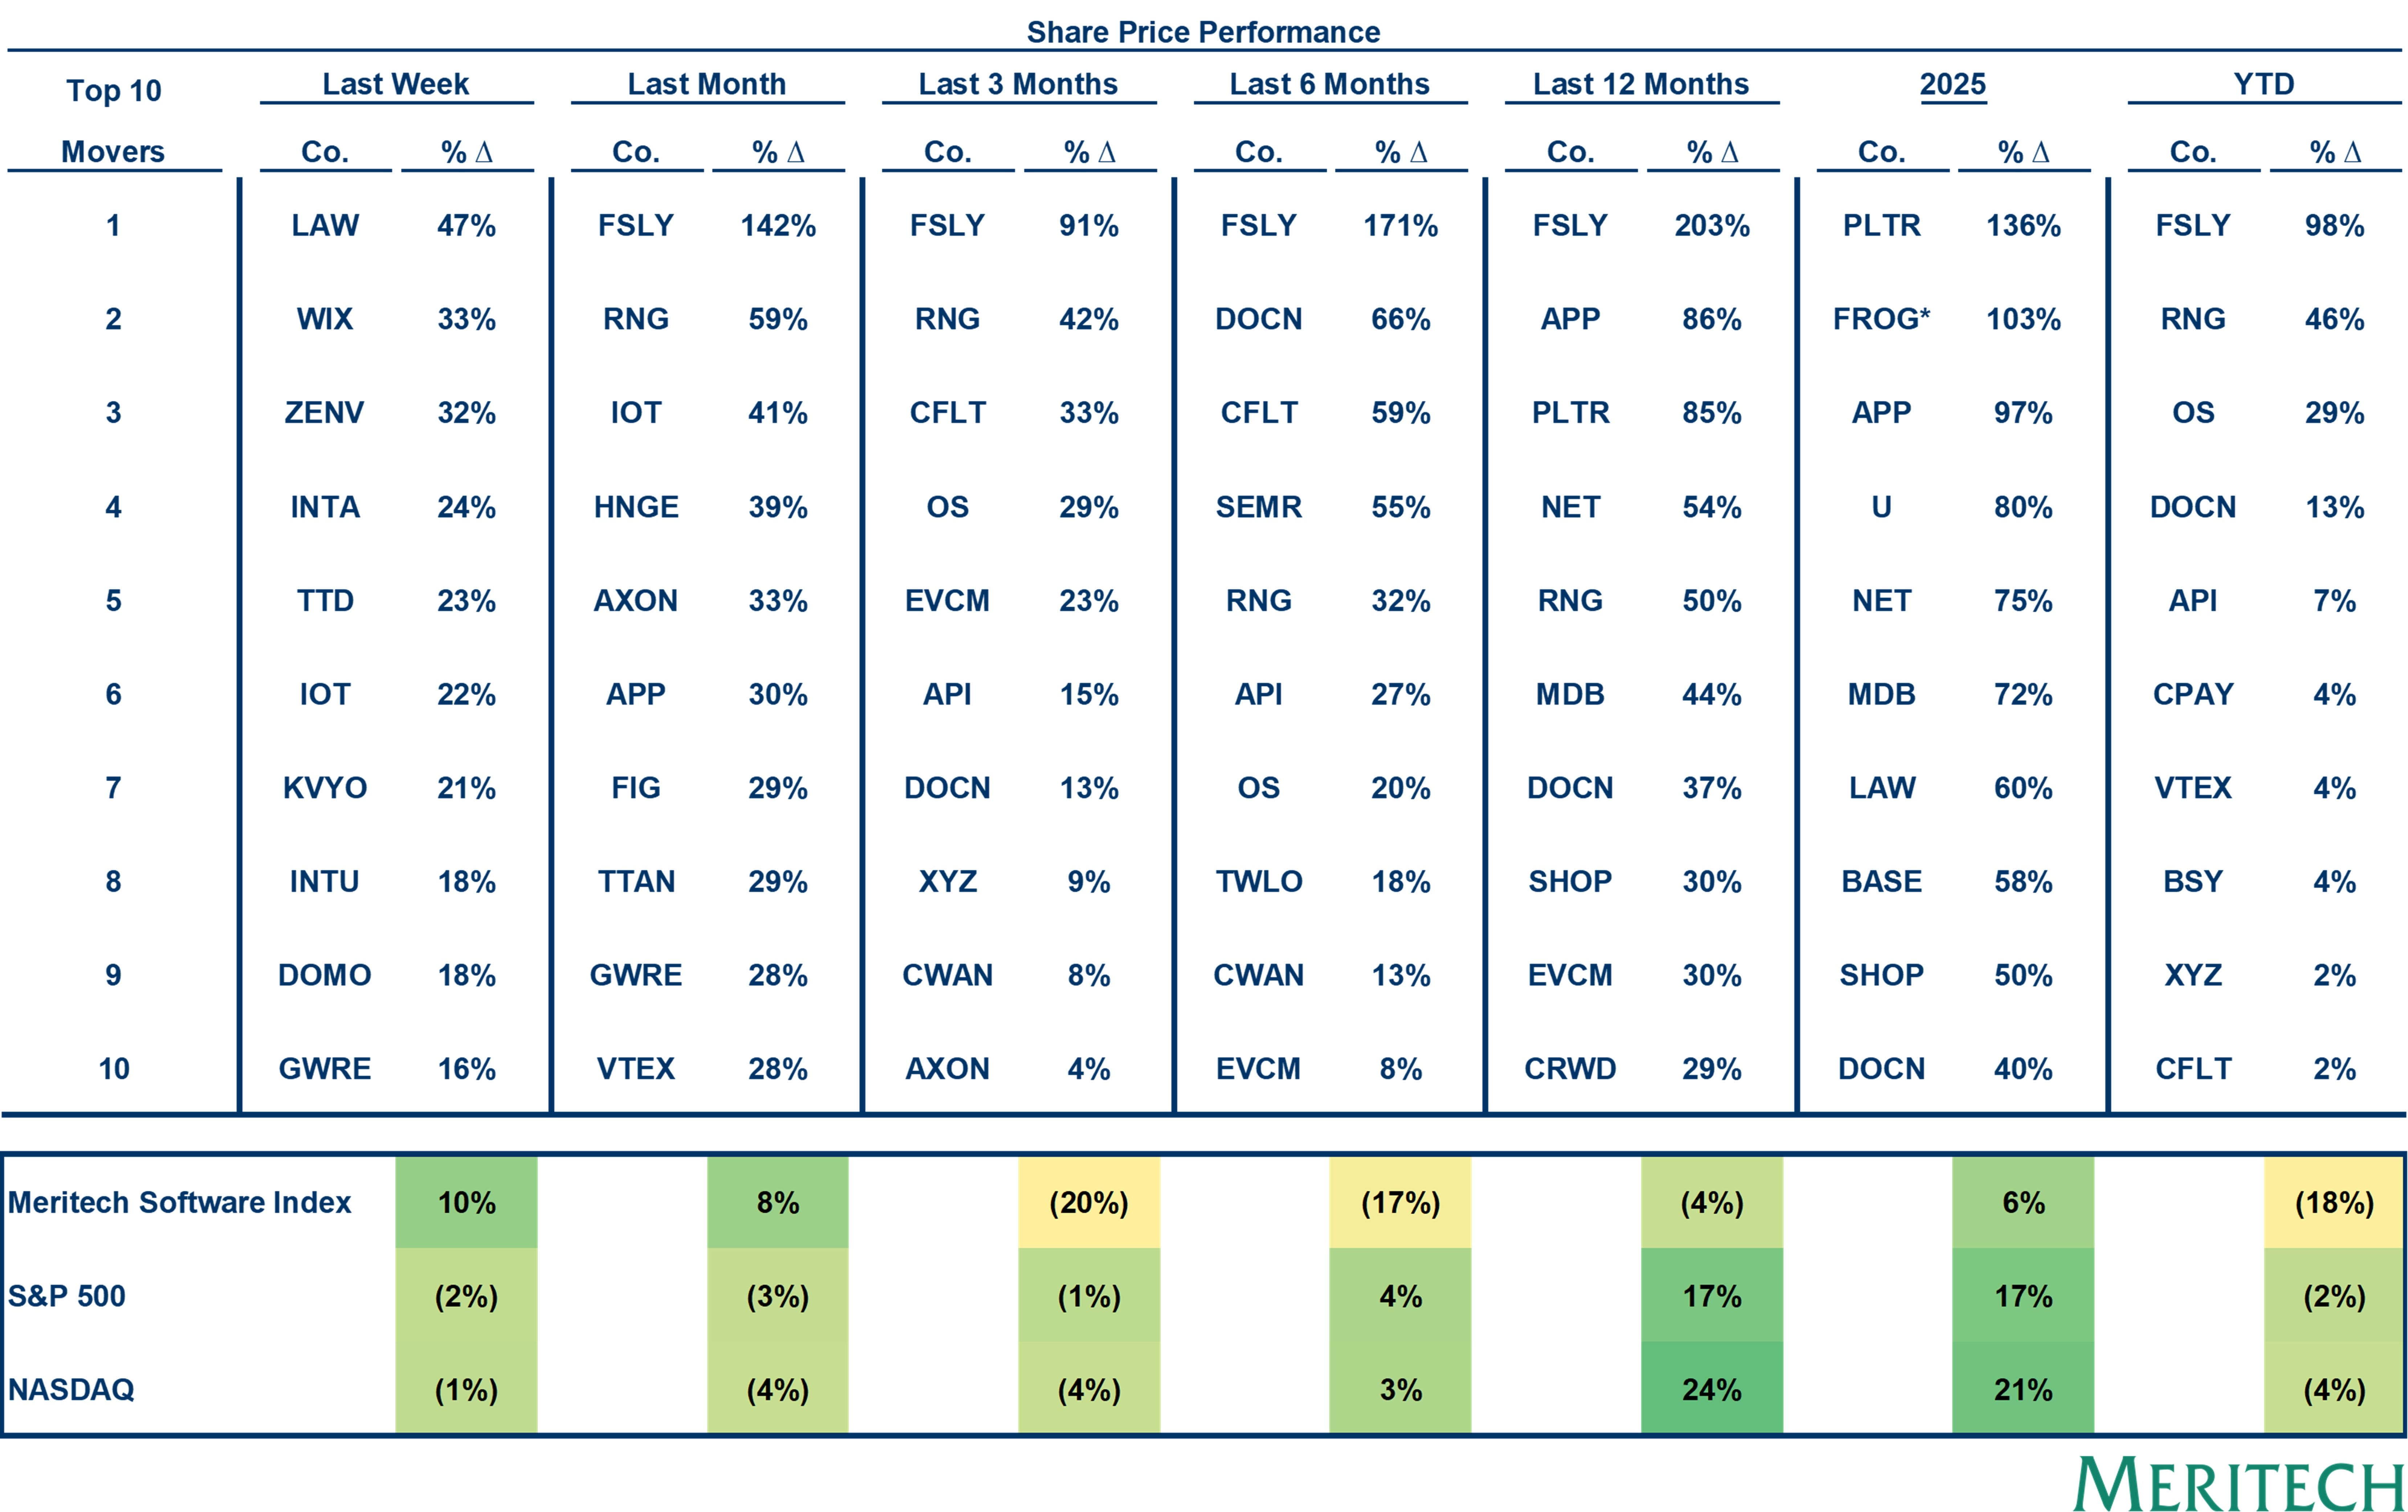
Source: CIQ as of 06-March-2026. Note: Week defined as last 5 trading days, month defined as last 22 trading days, 3 months defined as 65 trading days, 6 months defined as 122 trading days. * Indicates current or former Meritech investment.
Median Indexed Share Price | AI Tailwinds vs. Others
We segmented our software index into companies with clear AI tailwinds vs. those without or neutral. Those with clear AI tailwinds had significantly better returns than those without, and that gap dramatically expanded towards the end of 2024 and the start of 2025. That gap is beginning to close in 2026, with both buckets suffering large share price declines, though prices have bounced back a bit over the past week.
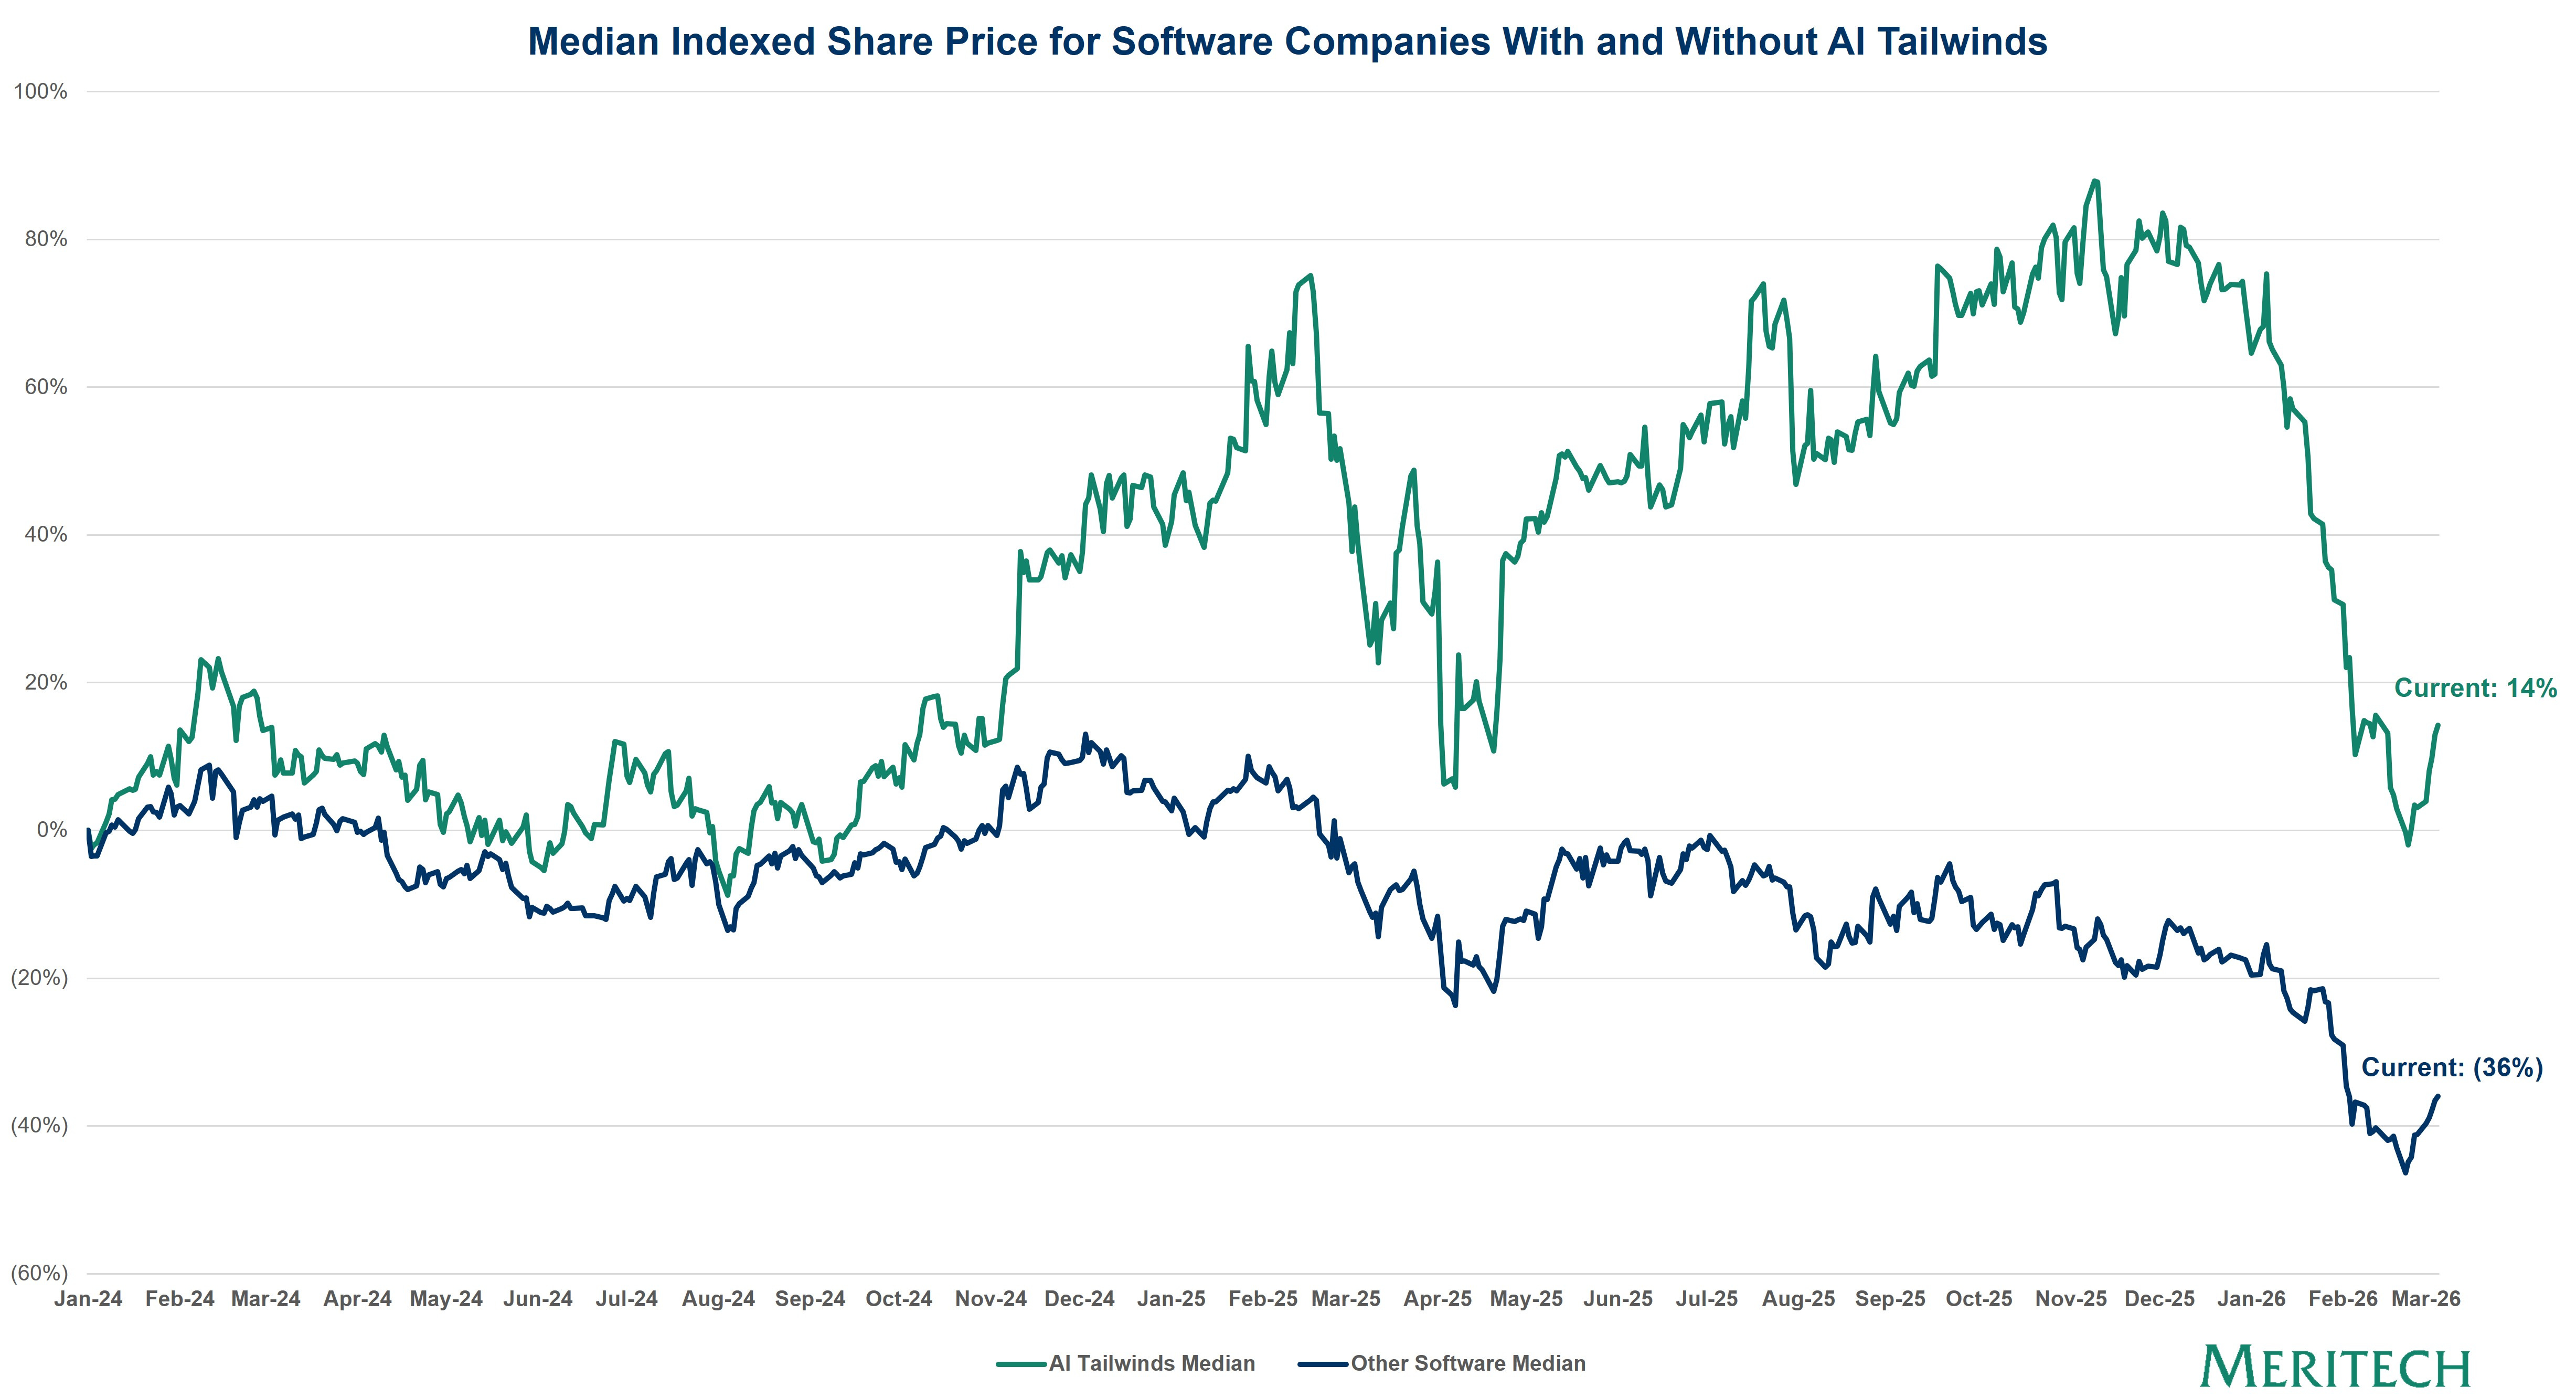
Source: CIQ as of 06-March-2026. Note: AI Tailwinds companies include DDOG, FROG*, SNOW, APP, NET, CRWD, CYBR, DOCS, FIG, MDB, PLTR, PANW, RBRK, SHOP, ZS, and NOW.
Enterprise Value / NTM Revenue Multiples | All Software, Quartiles
The chart below shows the 25th, 50th, 75th, and 90th percentile NTM revenue multiples. Overall, multiples have stabilized from their ZIRP peaks, but are down more recently.
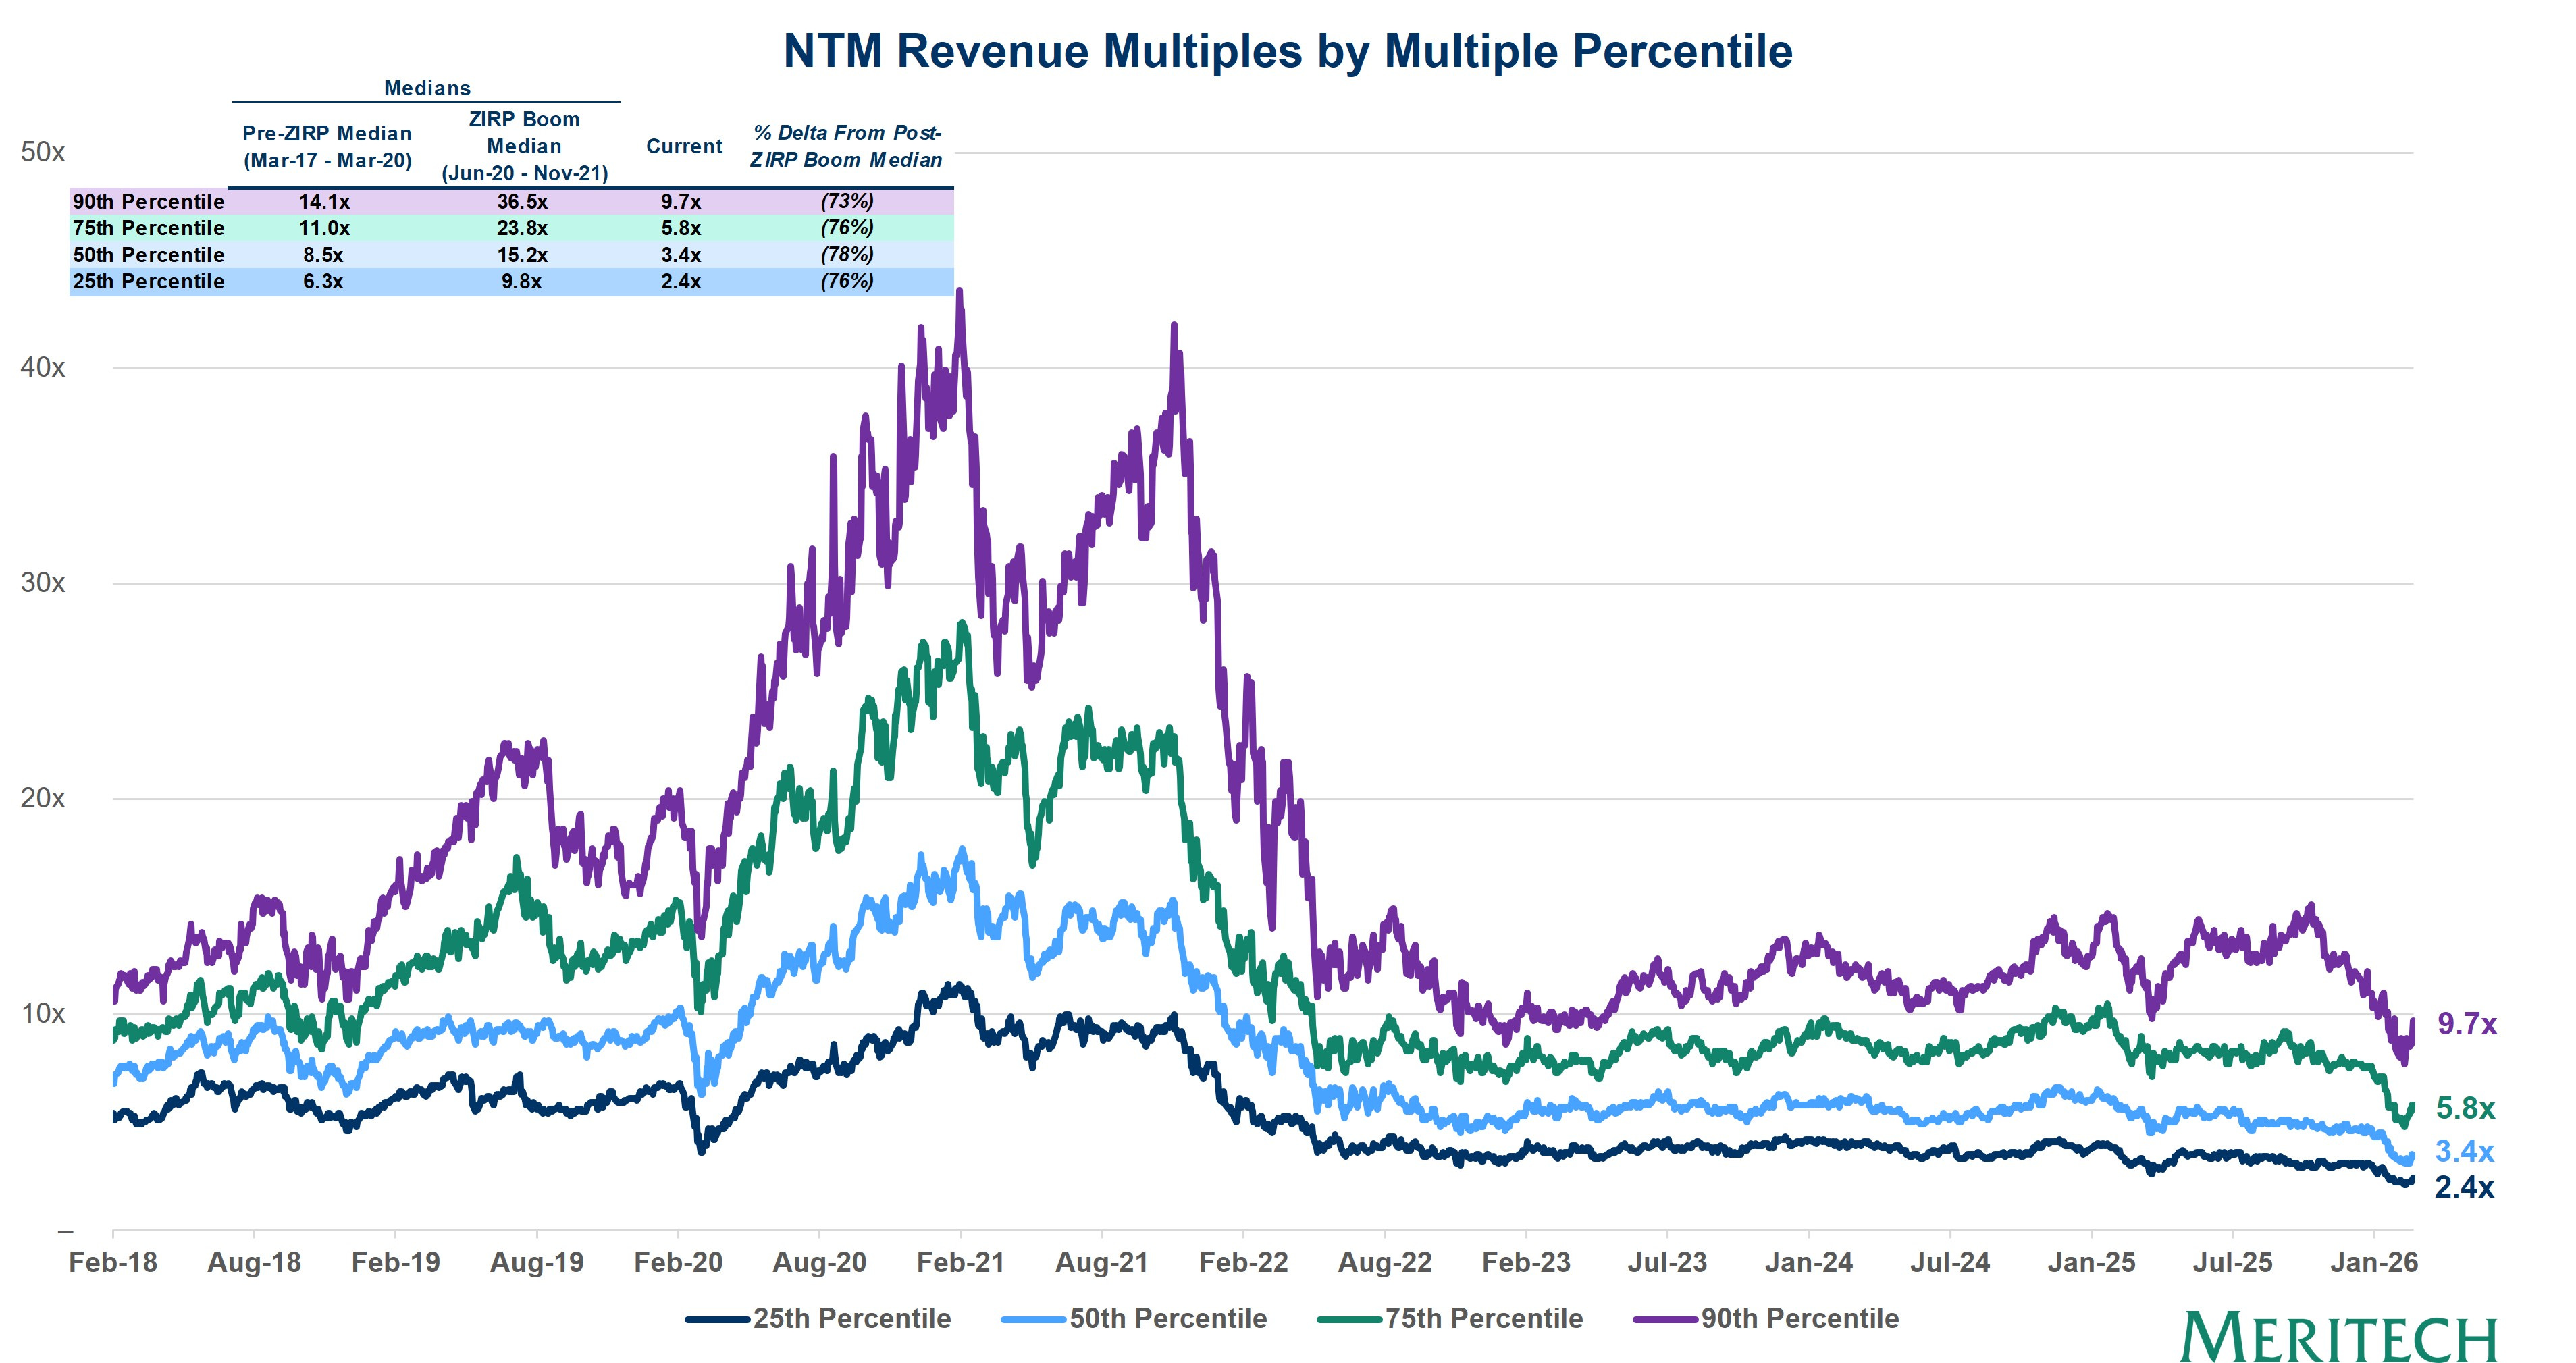
Source: CIQ as of 06-March-2026. Note: NTM defined as next-twelve months consensus estimate.
Enterprise Value / Implied ARR | Top 10 and All Software
The following chart shows Implied ARR multiples for the software market over the last 8 years. While the current overall median multiple of 3.7x is 57% below the pre-ZIRP median of 8.7x, the current top 10 median of 13.5x is 19% below the pre-ZIRP median of 16.6x.
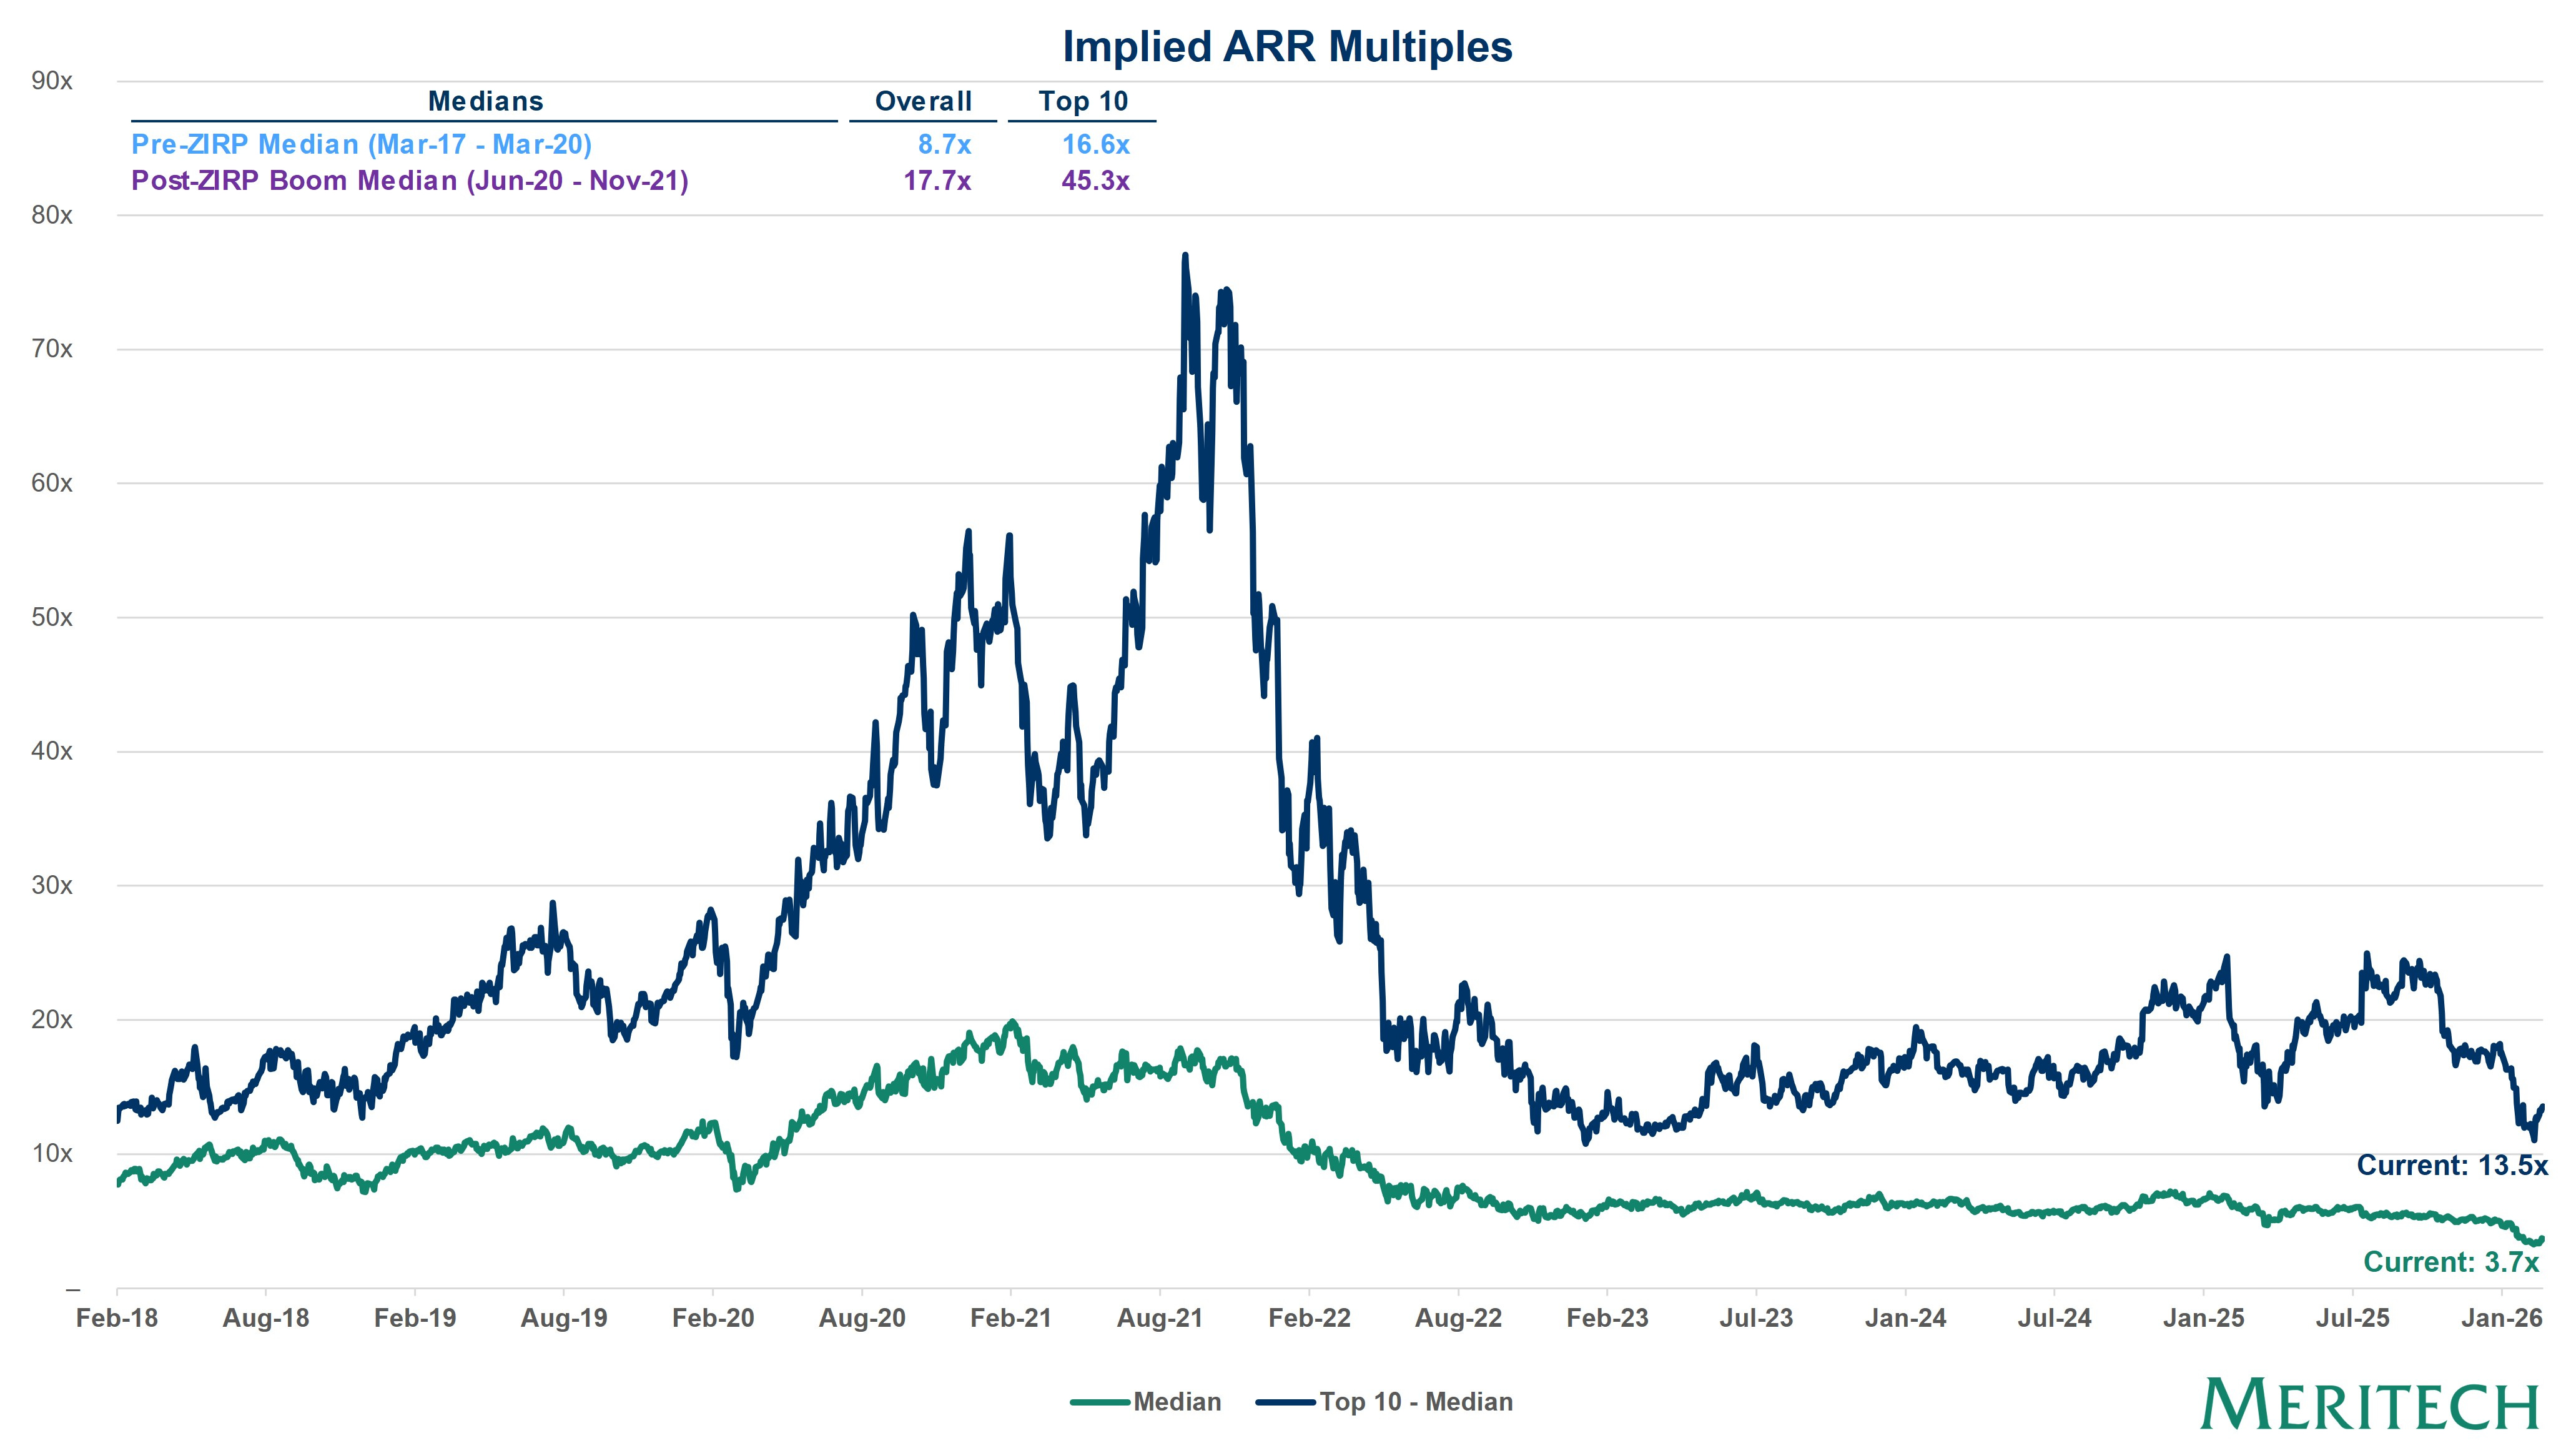
Source: Company Filings and CIQ as of 06-March-2026. Note: Implied ARR defined as quarterly total revenue multiplied by four.
Growth-Adjusted Revenue Multiples | Top 10 and All Software
The following chart looks at growth-adjusted revenue multiples for the software market over the last 8 years. The current median multiple is 0.26x, 13% below the pre-ZIRP median of 0.30x but down 73% from the 2021 high of 0.98x. Top 10 multiples have fared even better at 17% above the pre-ZIRP median of 0.70x.
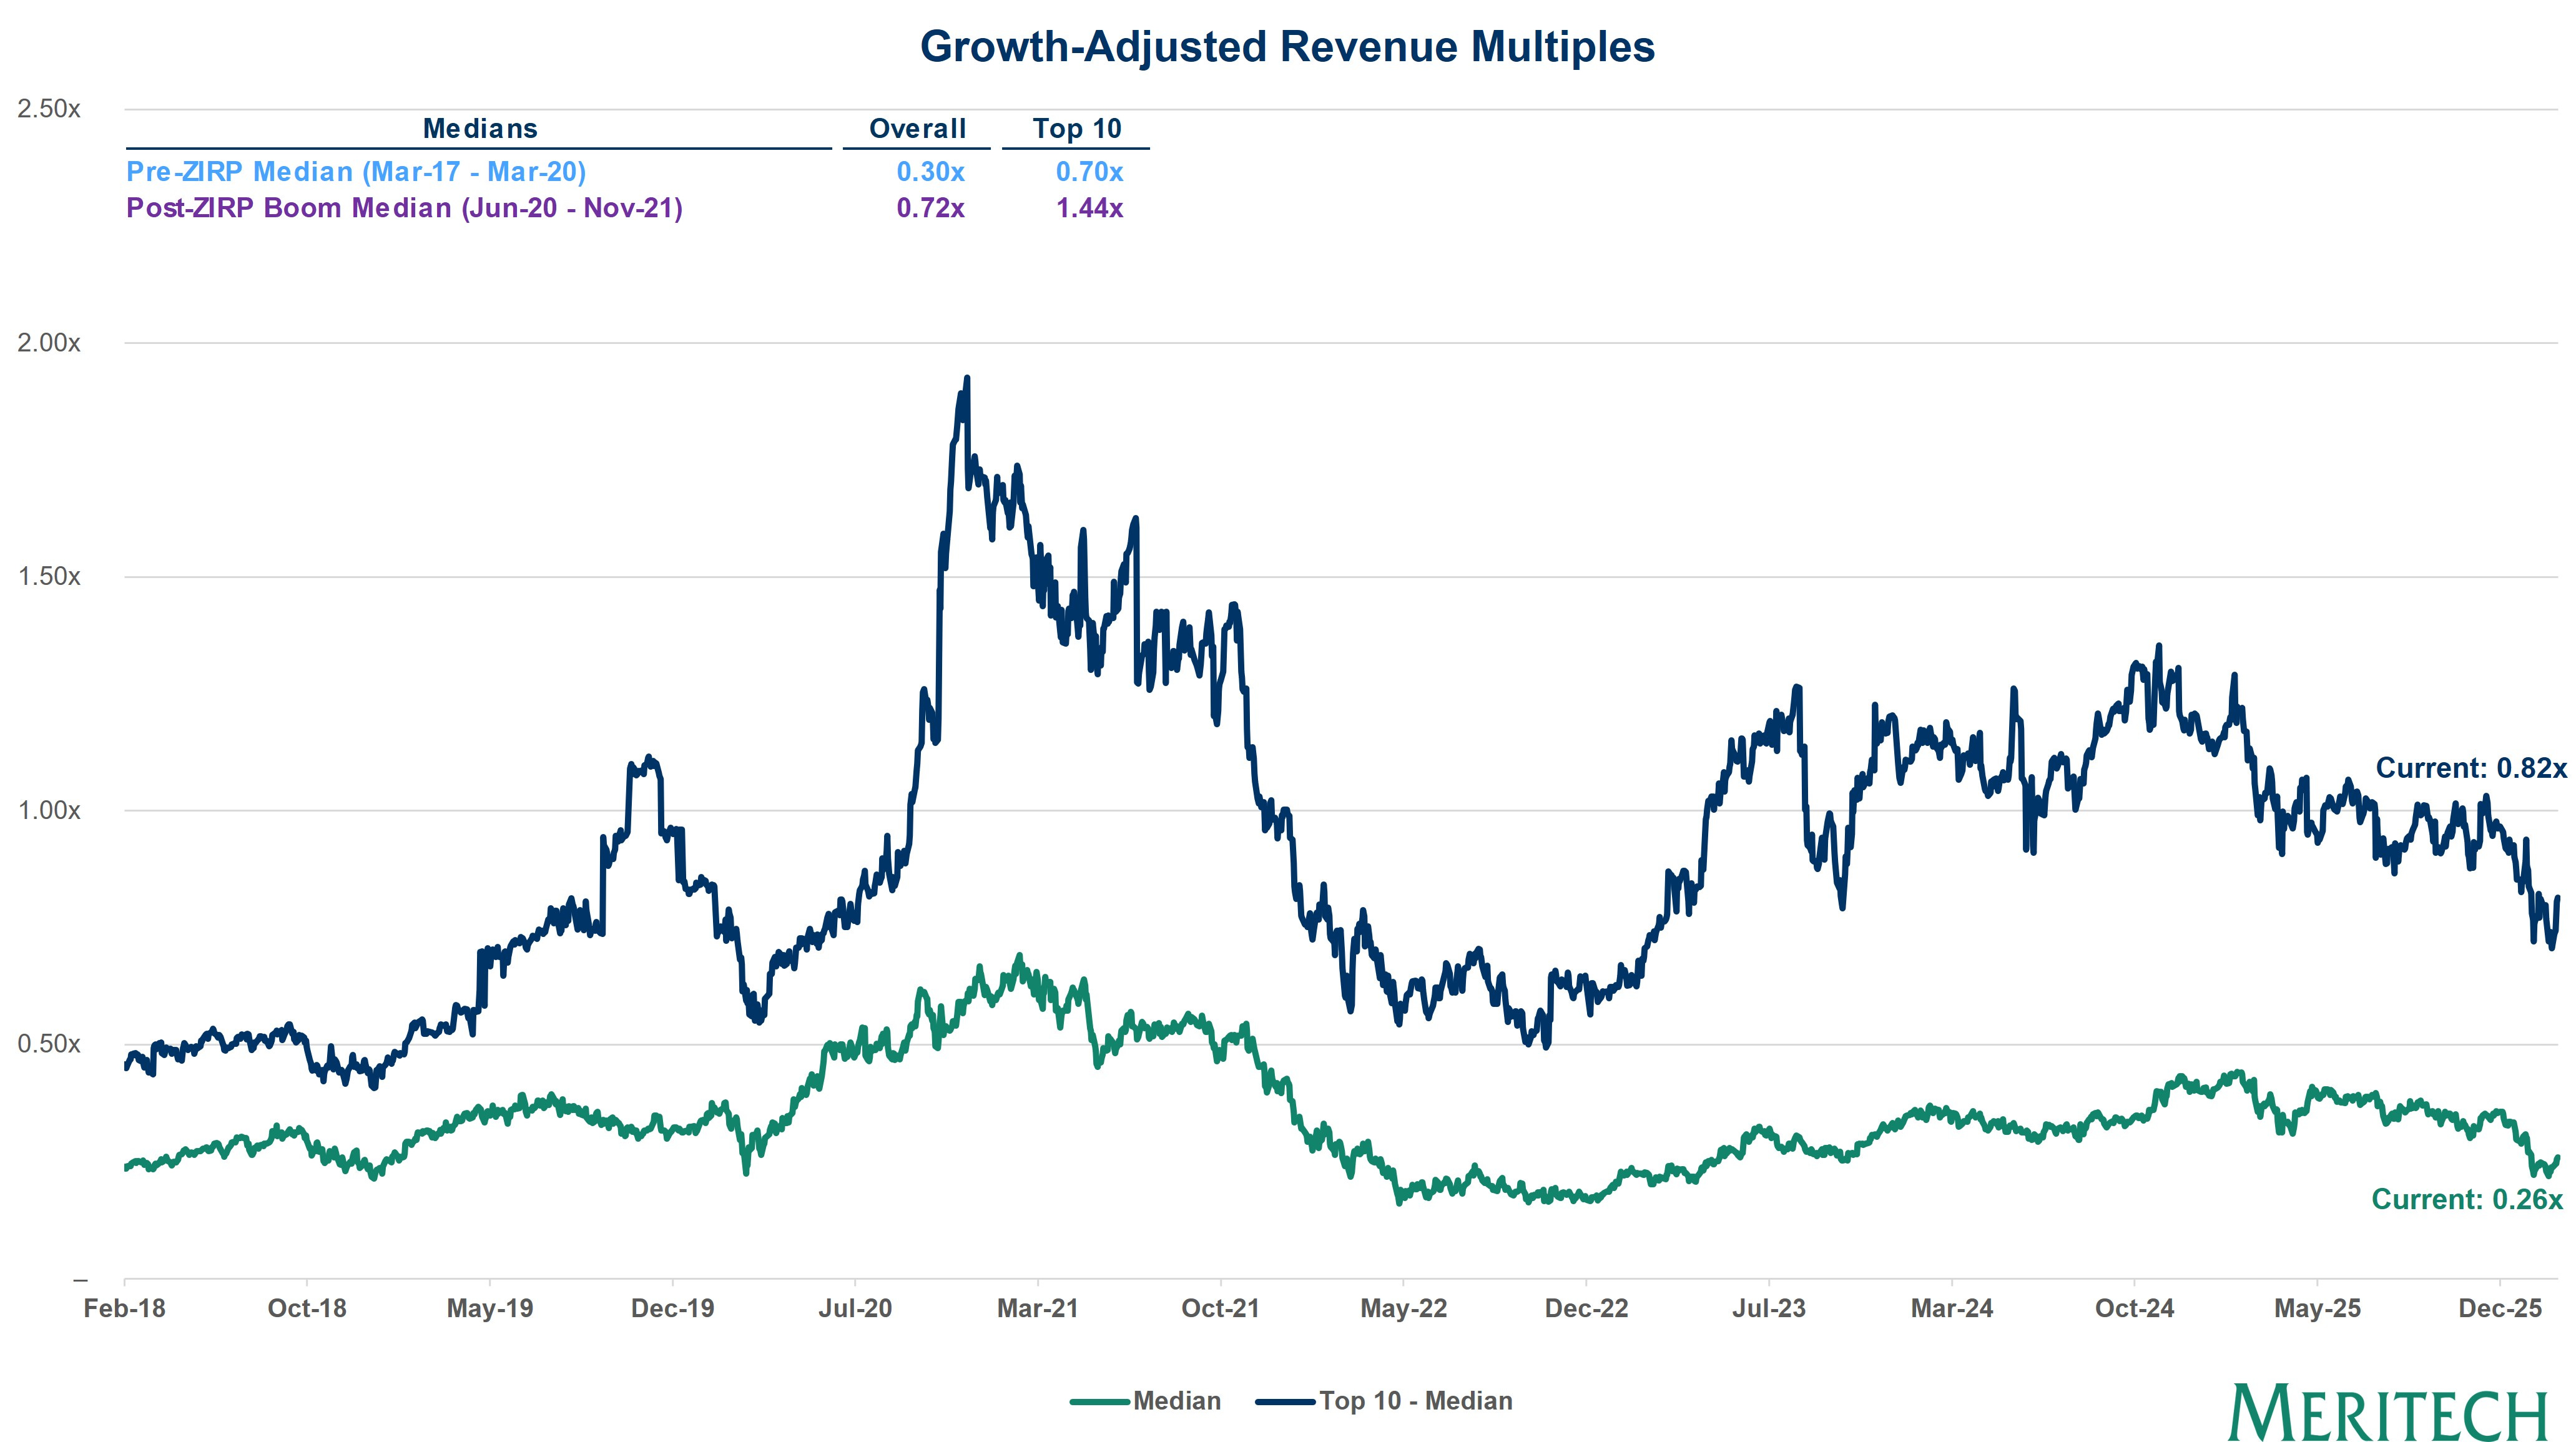
Source: CIQ as of 06-March-2026.
Top One Company vs. 50th Percentile ARR Multiples | All Software
The following chart compares the highest monthly median ARR multiple across all public software to the 50th percentile ARR multiple. This analysis shows that the outlier effect in public software is even more pronounced now than even in 2021. In 2021, the entire index saw multiples expand, but over the past almost 2 years, the top company — in this case, Palantir — has posted the widest spread ever relative to the overall or 50th percentile company.
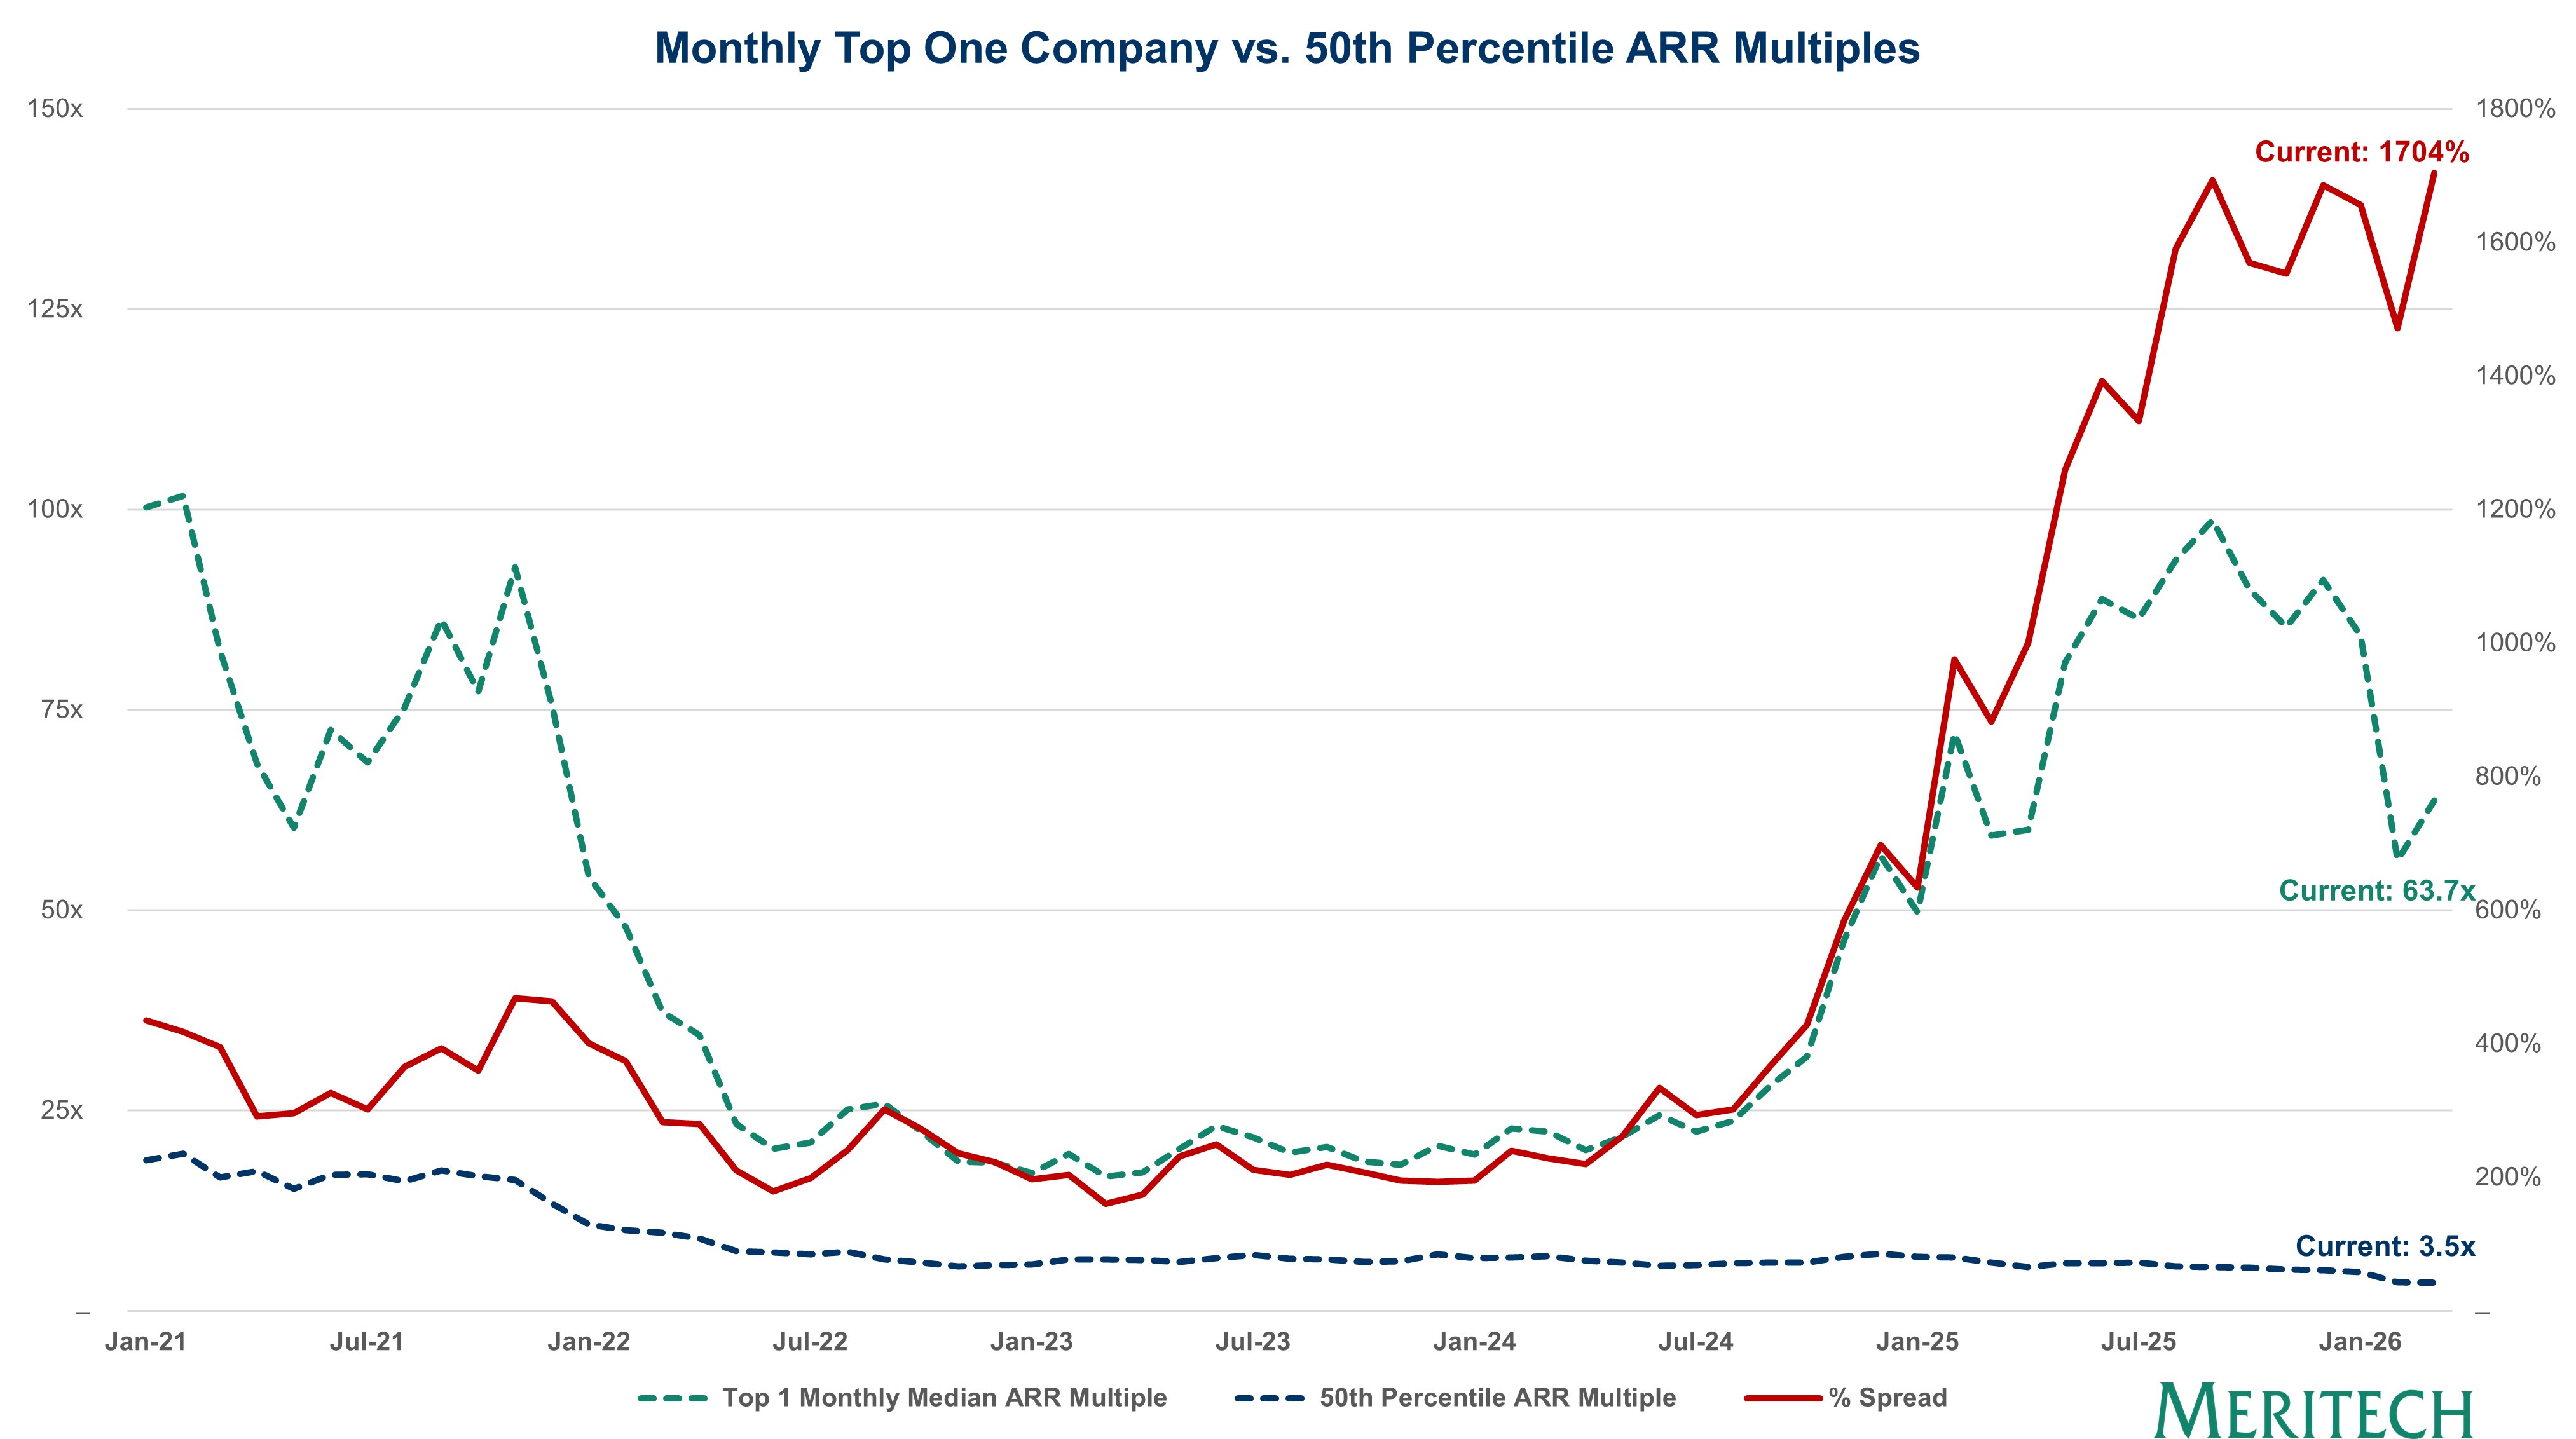
Source: CIQ as of 06-March-2026. 50th percentile ARR multiple is a monthly metric based on all daily ARR multiples across public software companies each month. Top one company multiple based on monthly median ARR multiple. March metrics are as of month-to-date.
Median NTM Revenue Growth and Free Cash Flow Margins | All Software
Public software companies have shifted toward efficiency post-ZIRP. Revenue growth rates have fallen sharply, and free cash flow margins have risen across the board. There are only a few companies growing by more than 30% year-over-year today. It will be interesting to see which companies can innovate (and also grow faster) by utilizing AI.
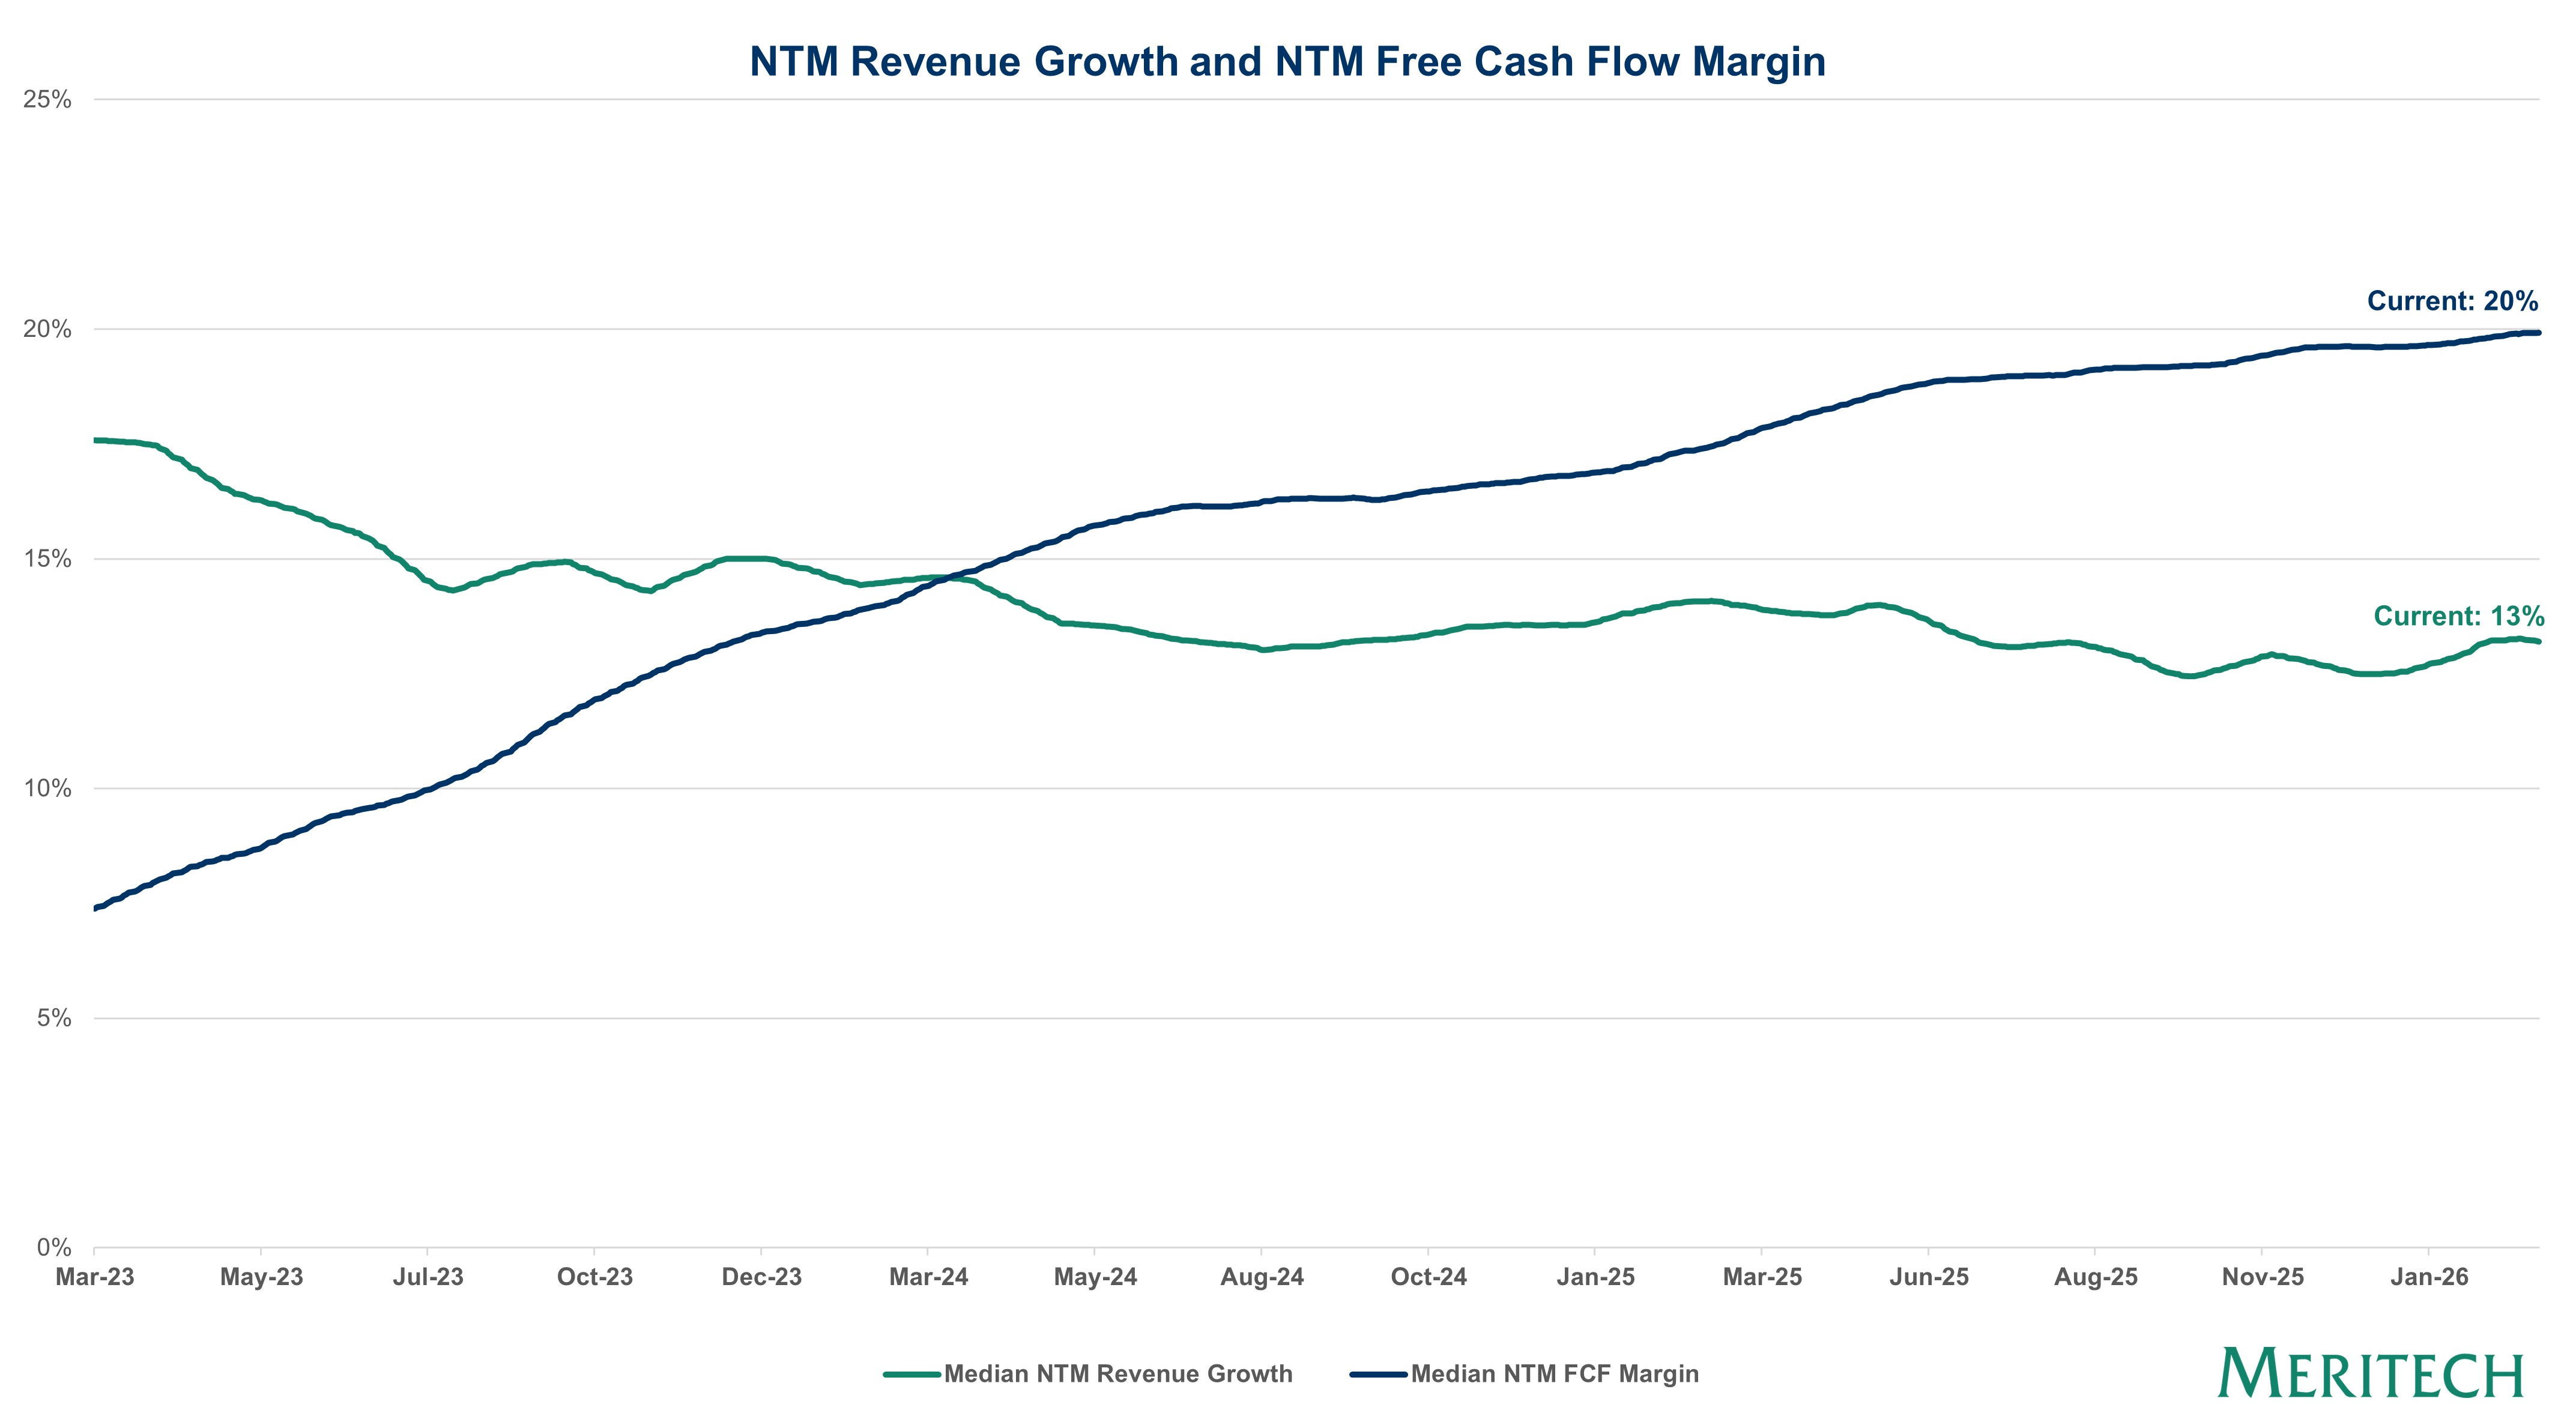
Source: CIQ as of 06-March-2026 and Company Filings. Note: NTM defined as next-twelve months consensus estimate. Free cash flow defined as cash flow from operations minus capital expenditures and capitalized software costs. Data represents the 90-day rolling average.
2) Growth and Profitability - Updated Weekly
Rule of 40 Composition | All Software
Previously, we showed multiples segmented by growth rate and profitability. Here is a more nuanced view, breaking down the composition of the Rule of 40 between growth and cash flow margins and showing both the median multiple and the median Rule of 40 of each bucket. Simple regressions comparing multiples against growth or Rule of 40 are valuable, but this analysis shows that the composition of your Rule of 40 can meaningfully impact your valuation. This is highlighted in the red boxes in the tables, which show that companies with similar Rule of 40 but growing faster can trade at a significant premium (9.3x) to companies with lower growth and higher free cash flow margins (3.3x). This shows the market rewards growth above all in the Rule of 40 calculation. The bottom right includes AppLovin and Palantir.
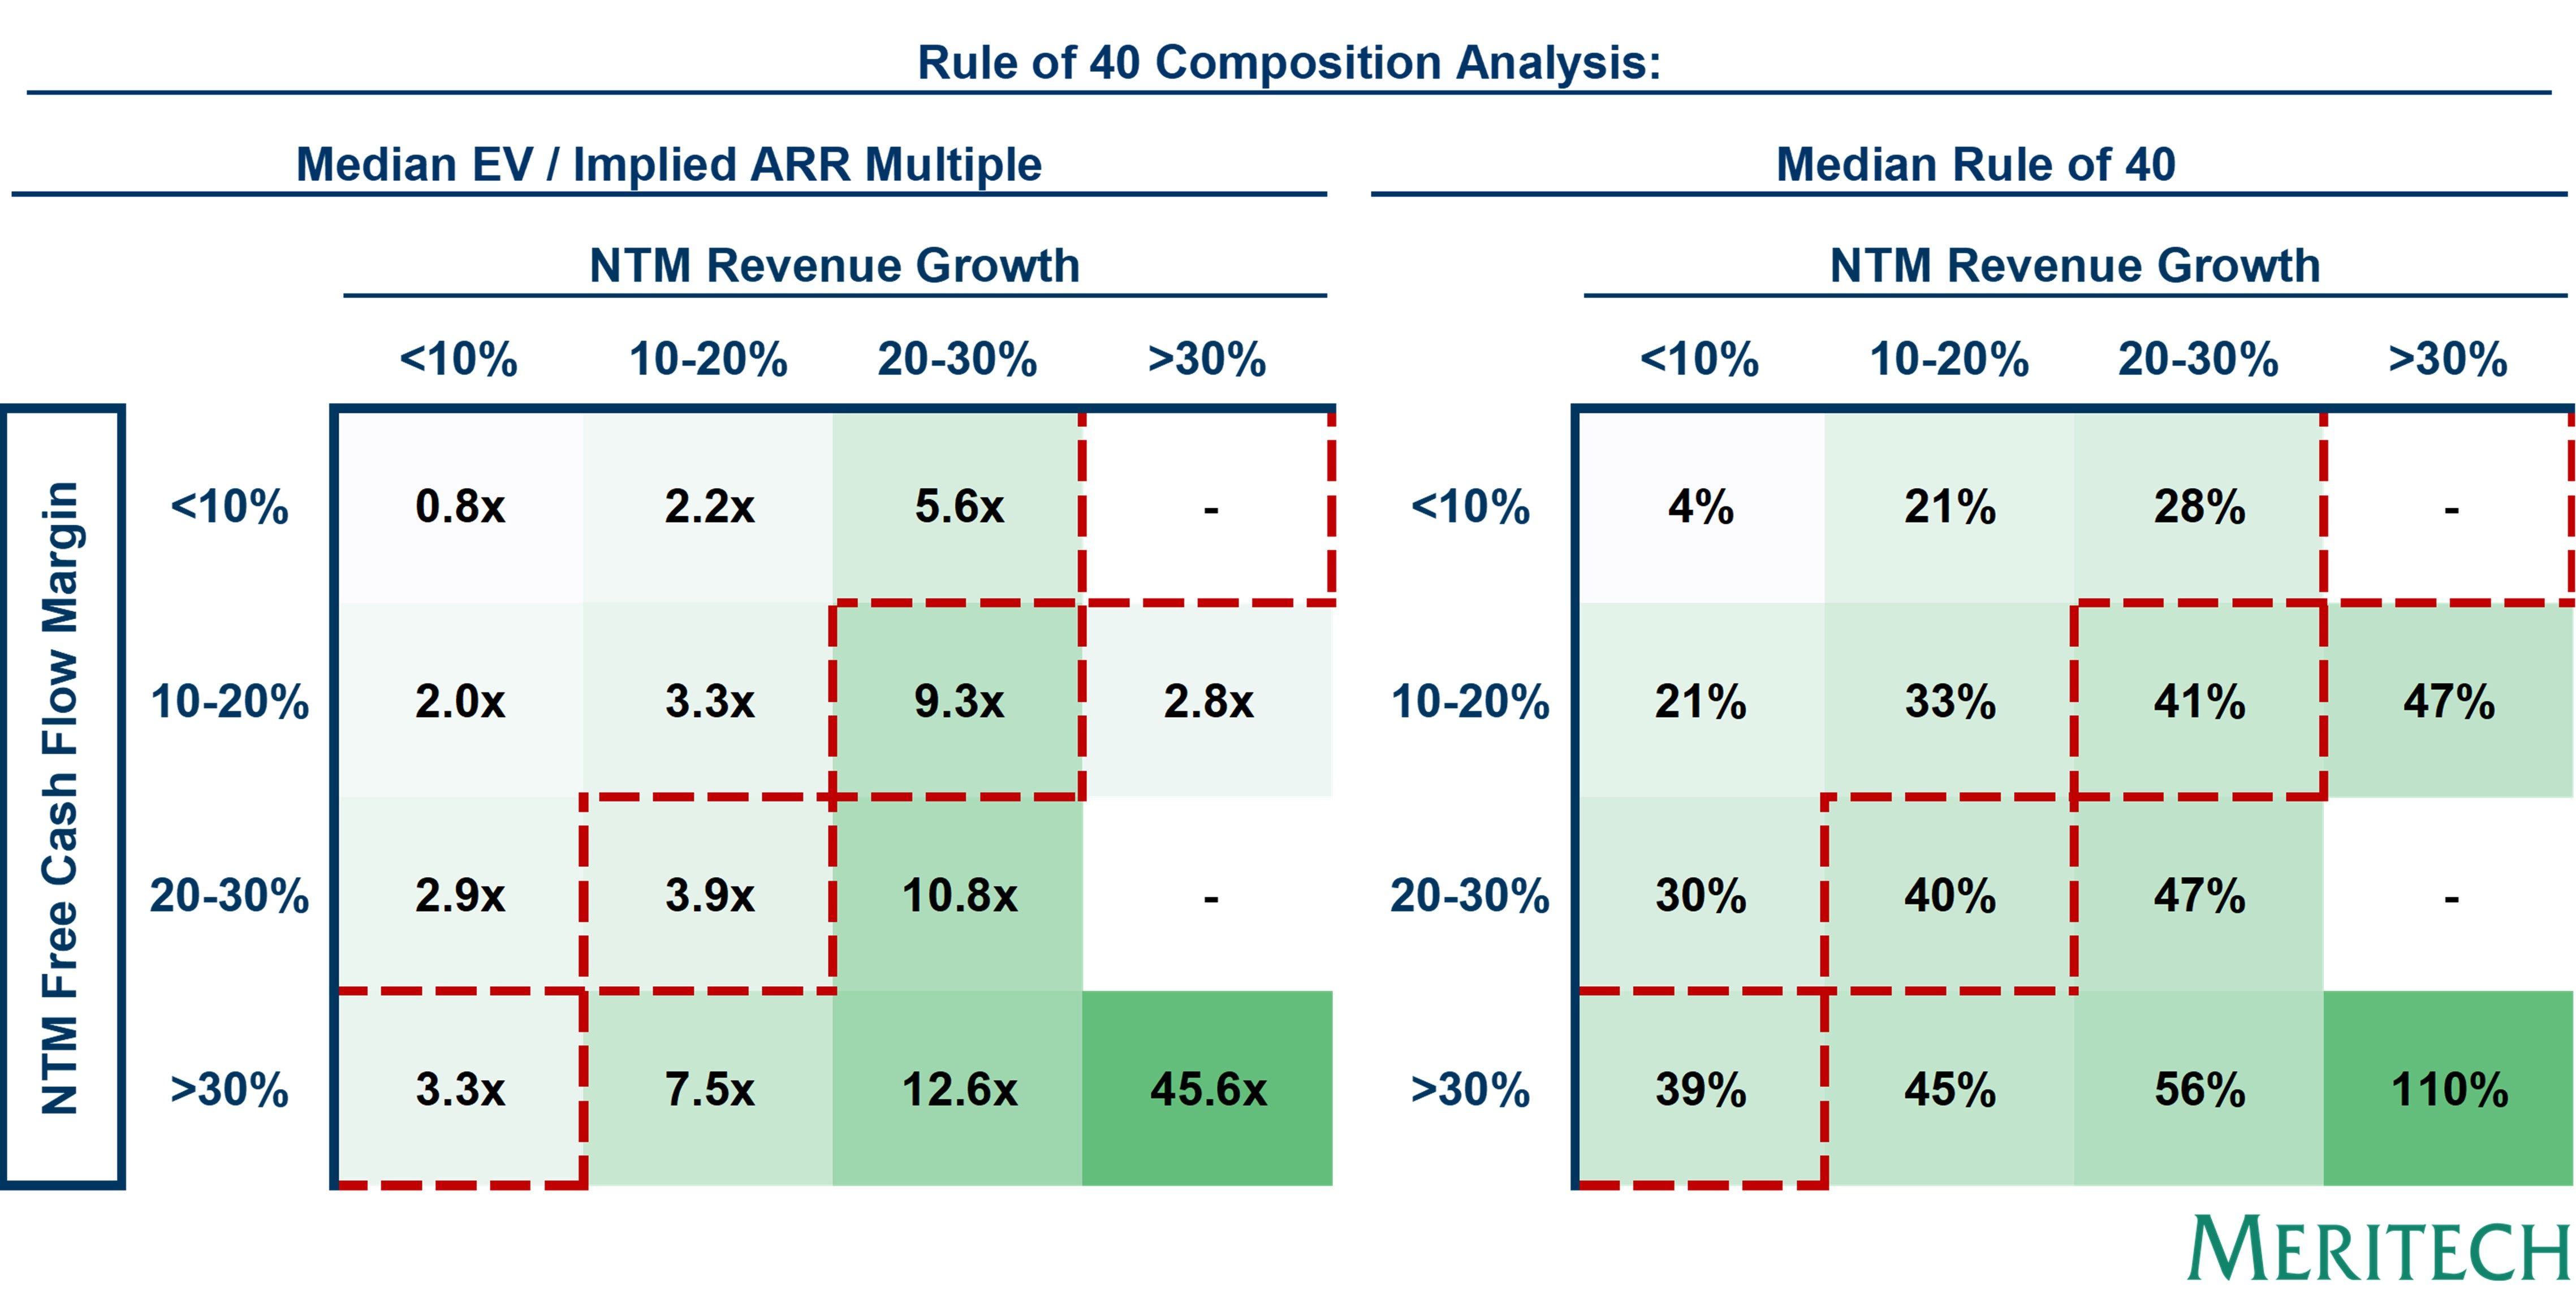
Source: Company Filings and CIQ as of 06-March-2026. Note: NTM defined as next-twelve months consensus estimate. Implied ARR defined as quarterly total revenue multiplied by four. Free cash flow defined as cash flow from operations minus capital expenditures and capitalized software costs. Rule of 40 defined as NTM revenue growth + NTM free cash flow margin.
Performance by NTM Revenue Multiple Bucket | All Software
Only 10 public software companies trade above 10x NTM revenue, and 72% trade below 5x. Most companies that trade above 10x are both highly profitable (>20% FCF margins) and growing quickly (>20% ARR growth). The following analysis shows that only a few of the 100+ companies trade at “high” multiples. The public markets are concerned about AI risk, particularly for horizontal SaaS vendors. Most are also not growing quickly. So until these businesses can increase their revenue growth (likely through AI features), they will stay in the valuation “doghouse”.
Source: Company Filings and CIQ as of 06-March-2026. Note: NTM defined as next-twelve months consensus estimate. Implied ARR defined as quarterly total revenue multiplied by four. Free cash flow defined as cash flow from operations minus capital expenditures and capitalized software costs. Rule of 40 defined as NTM revenue growth + NTM free cash flow margin.
Relative Importance of Revenue Growth vs. FCF Margin
The chart below is based on a two-factor regression of NTM revenue growth and NTM FCF margin to ARR multiple. It shows that growth is 2.8x as correlated with multiple vs. FCF margin. Said another way, a 1% increase in growth would have the same impact on multiple as a 2.8% increase in FCF margin.
Source: Company Filings and CIQ as of 06-March-2026. Note: NTM defined as next-twelve months consensus estimate. Implied ARR defined as quarterly total revenue multiplied by four. Free cash flow defined as cash flow from operations minus capital expenditures and capitalized software costs. Rule of 40 defined as NTM revenue growth + NTM free cash flow margin.
Trended Regression Analysis | Growth vs. Rule of 40 vs. Meritech Rule of 40
The chart below shows the Meritech Rule of 40 correlation plotted over time alongside the standard growth rate and Rule of 40 correlations. Following the market sell-off and multiple compression in early 2022, growth and Rule of 40 correlations converged. The Meritech Rule of 40 shows a consistently higher correlation than growth or the traditional Rule of 40.
Source: Company Filings and CIQ as of 06-March-2026. Note: NTM defined as next-twelve months consensus estimate. Implied ARR defined as quarterly total revenue multiplied by four. Free cash flow defined as cash flow from operations minus capital expenditures and capitalized software costs. Rule of 40 defined as NTM revenue growth + NTM free cash flow margin. Meritech Rule of 40 calculation excludes companies with top decile residuals from the line of best fit. Data represents 120 day rolling average.
3) Company Rankings - Updated Weekly
Top 10 Implied ARR Multiple Companies
Note: See footnote on final chart in this section.
Top 10 Market Cap Companies
Source: Company Filings and CIQ as of 06-March-2026. Note: Implied ARR defined as quarterly total revenue multiplied by four. Annualized Gross Profit defined as quarterly gross profit multiplied by four. Free cash flow defined as cash flow from operations minus capital expenditures and capitalized software costs. LTM Rule of 40 defined as Implied ARR Growth + LTM free cash flow margin. Payback period shown in months. Payback period calculated as prior quarter LTM non-GAAP sales and marketing expense divided by current quarter LTM net new implied ARR multiplied by current quarter LTM non-GAAP gross margin multiplied by 12. LTM (last-twelve-months) defined as the last four reported quarters. ACV defined as quarterly implied ARR divided by quarterly customer count. All financial figures are non-GAAP which adjust for items such as stock-based compensation, amortization of intangibles, and other one time and/or extraordinary expenses. Historical data includes over 100 public software companies as defined by Meritech. * Indicates current or former Meritech investment.
4) Operating Metrics and KPIs - Updated Quarterly After Earnings
LTM Net New Implied ARR by ARR Size Bucket
In the below chart, we show the median implied LTM NNARR for software companies based on their implied ARR bucket as of Q4 2025. Most companies with >$5B in implied ARR are adding >$1.3B ARR every year.
Source: Company Filings. Note: Implied ARR defined as quarterly total revenue multiplied by four.
Median Net Dollar Retention | All Software
Net dollar retention rates across public Software are showing early signs of bouncing back to 2024 levels, but it’s too early to tell if this will be a sustained trend.
Source: Company Filings. Note: The majority of companies have reported Q4 results, but Q4 values are subject to change as the remaining companies file.
Median Implied ARR per FTE | All Software
While companies are raising free cash flow margins, there is a focus on doing more with less in the age of AI.
Source: Company Filings. Note: Implied ARR defined as quarterly total revenue multiplied by four. The majority of companies have reported Q4 results, but Q4 values are subject to change as the remaining companies file.
Median Payback Period in Months | All Software
Payback periods have risen up since the end of ZIRP, but have been more stable for the past two years.
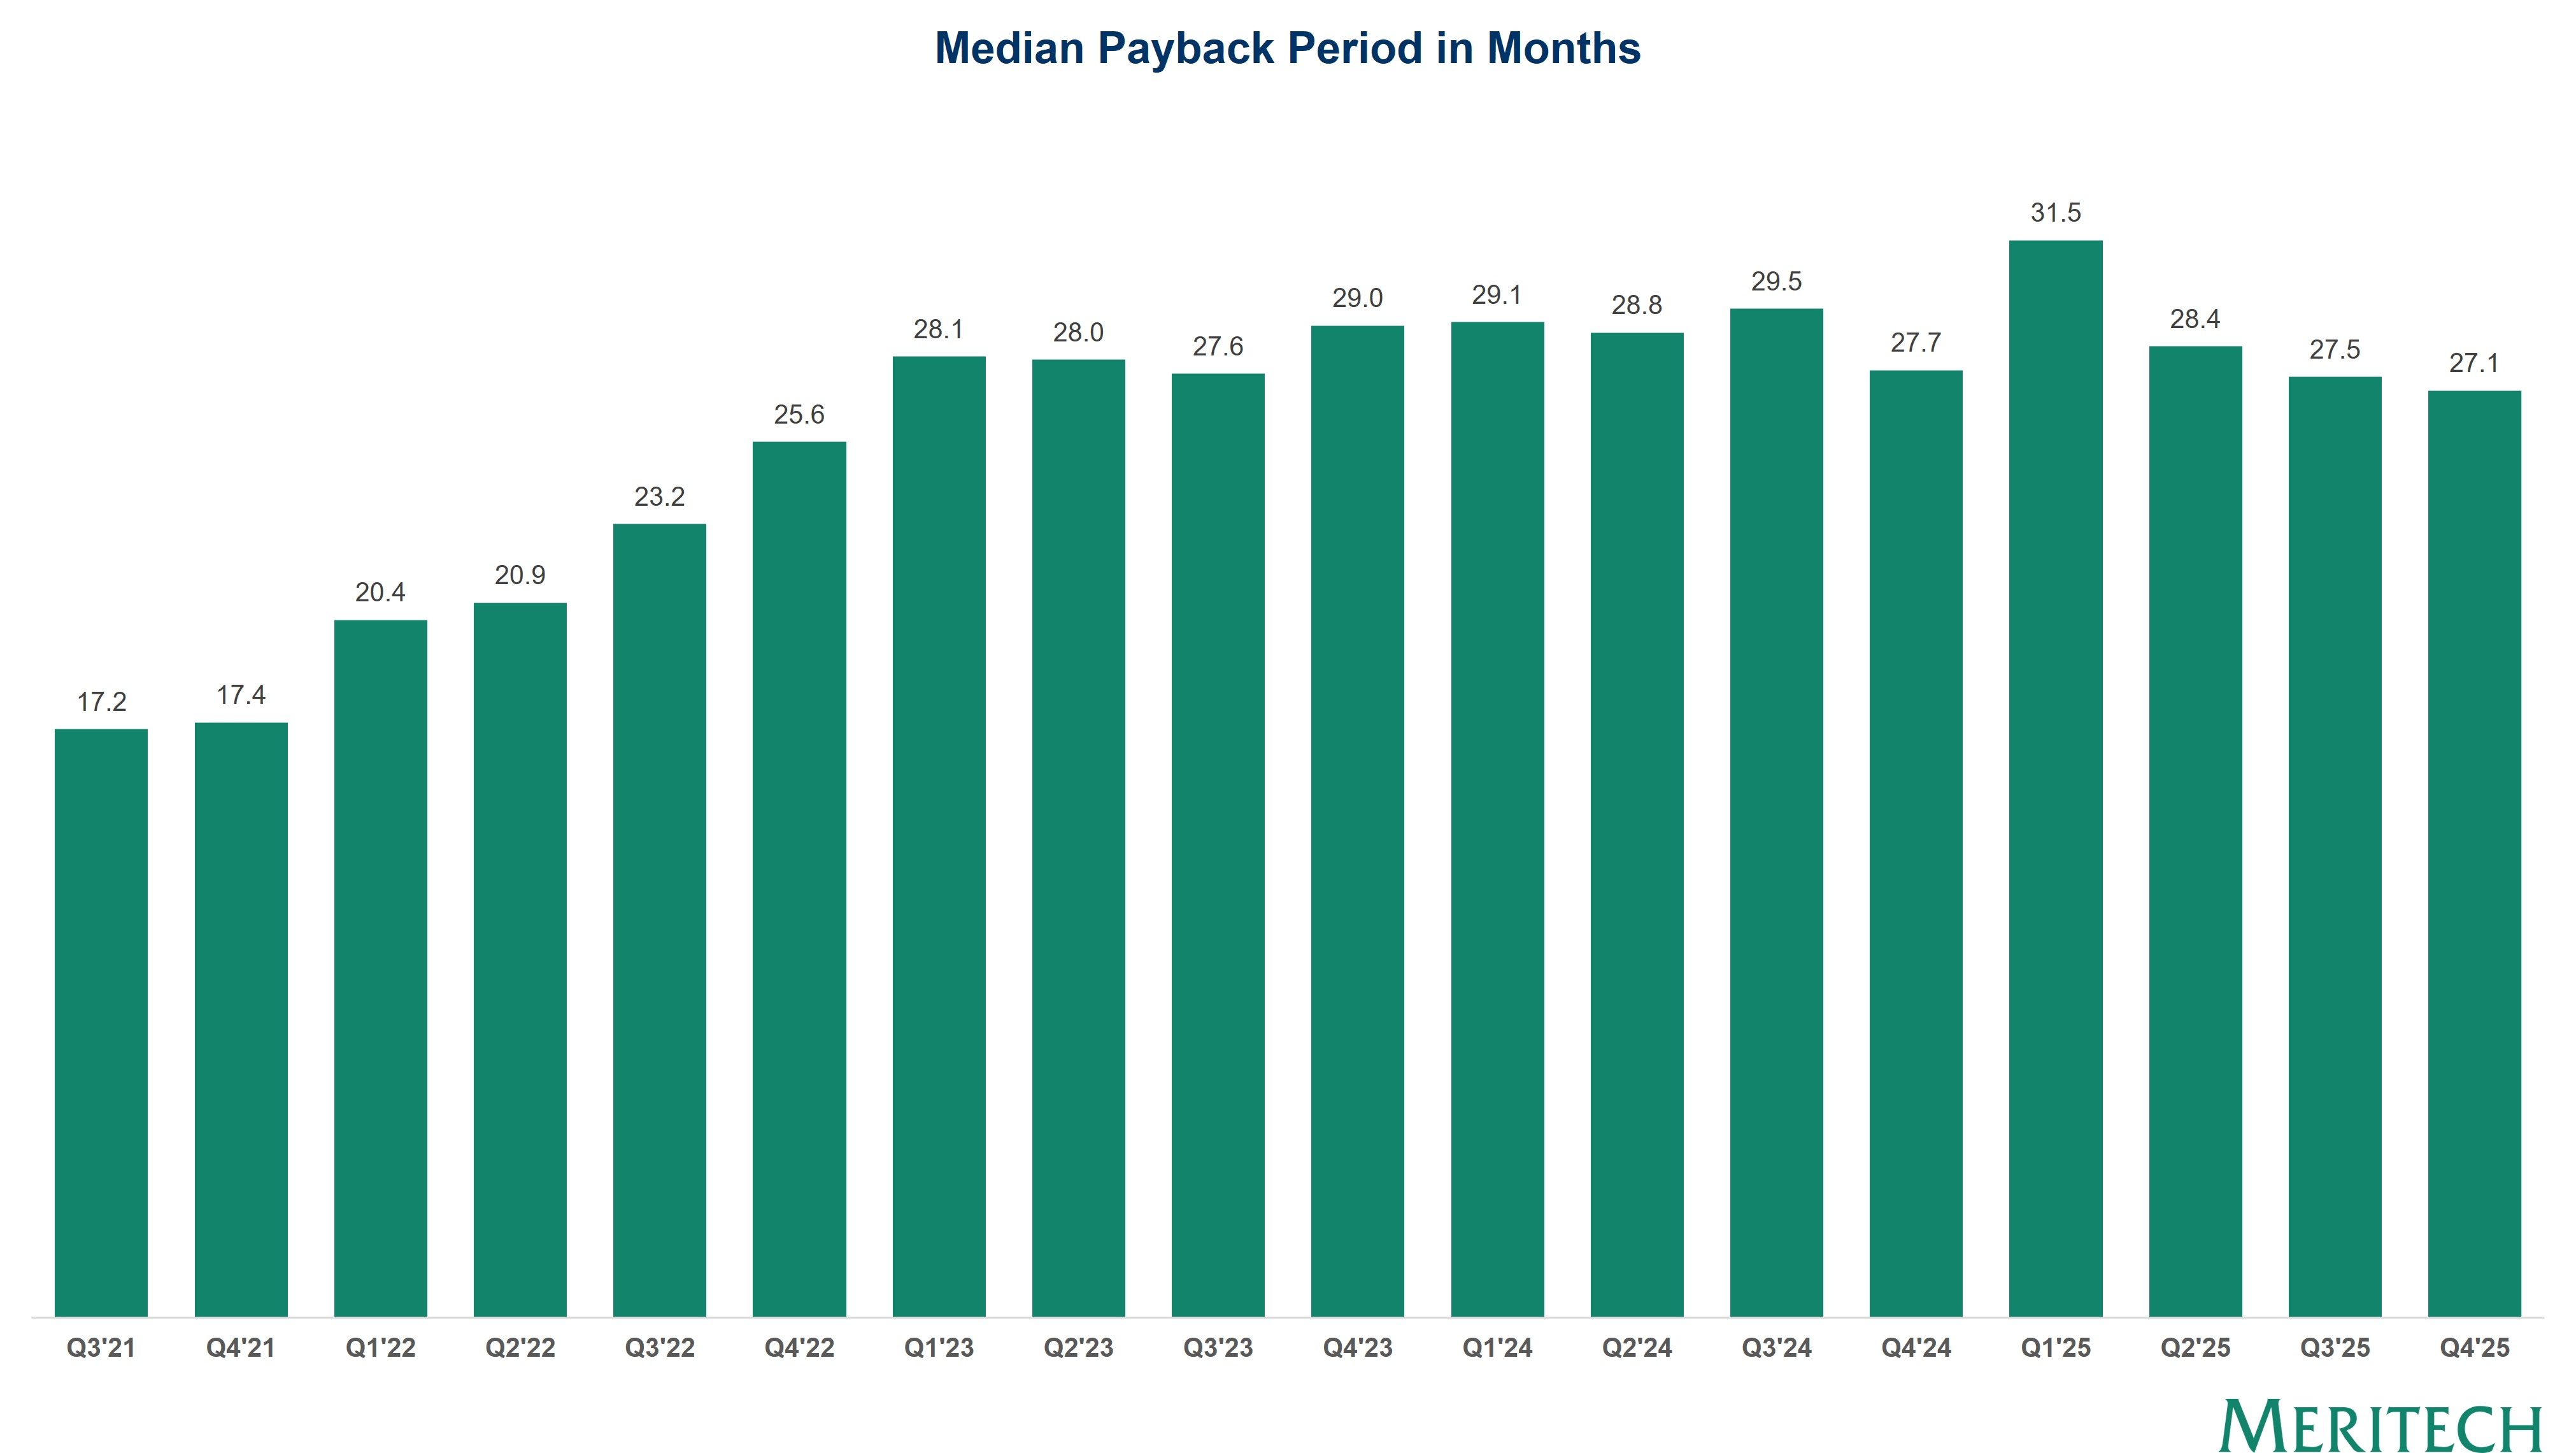
Source: Company Filings. Note: Payback period shown in months. Payback period calculated as prior quarter LTM non-GAAP sales and marketing expense divided by current quarter LTM net new implied ARR multiplied by current quarter LTM non-GAAP gross margin multiplied by 12. LTM (last-twelve-months) defined as the last four reported quarters. All financial figures are non-GAAP which adjust for items such as stock-based compensation, amortization of intangibles, and other one time and/or extraordinary expenses. The majority of companies have reported Q4 results, but Q4 values are subject to change as the remaining companies file.
Median % YoY Implied ARR Growth | All Software
Revenue growth has not come back across public software. To date, only a few companies have seen AI revenue growth acceleration.
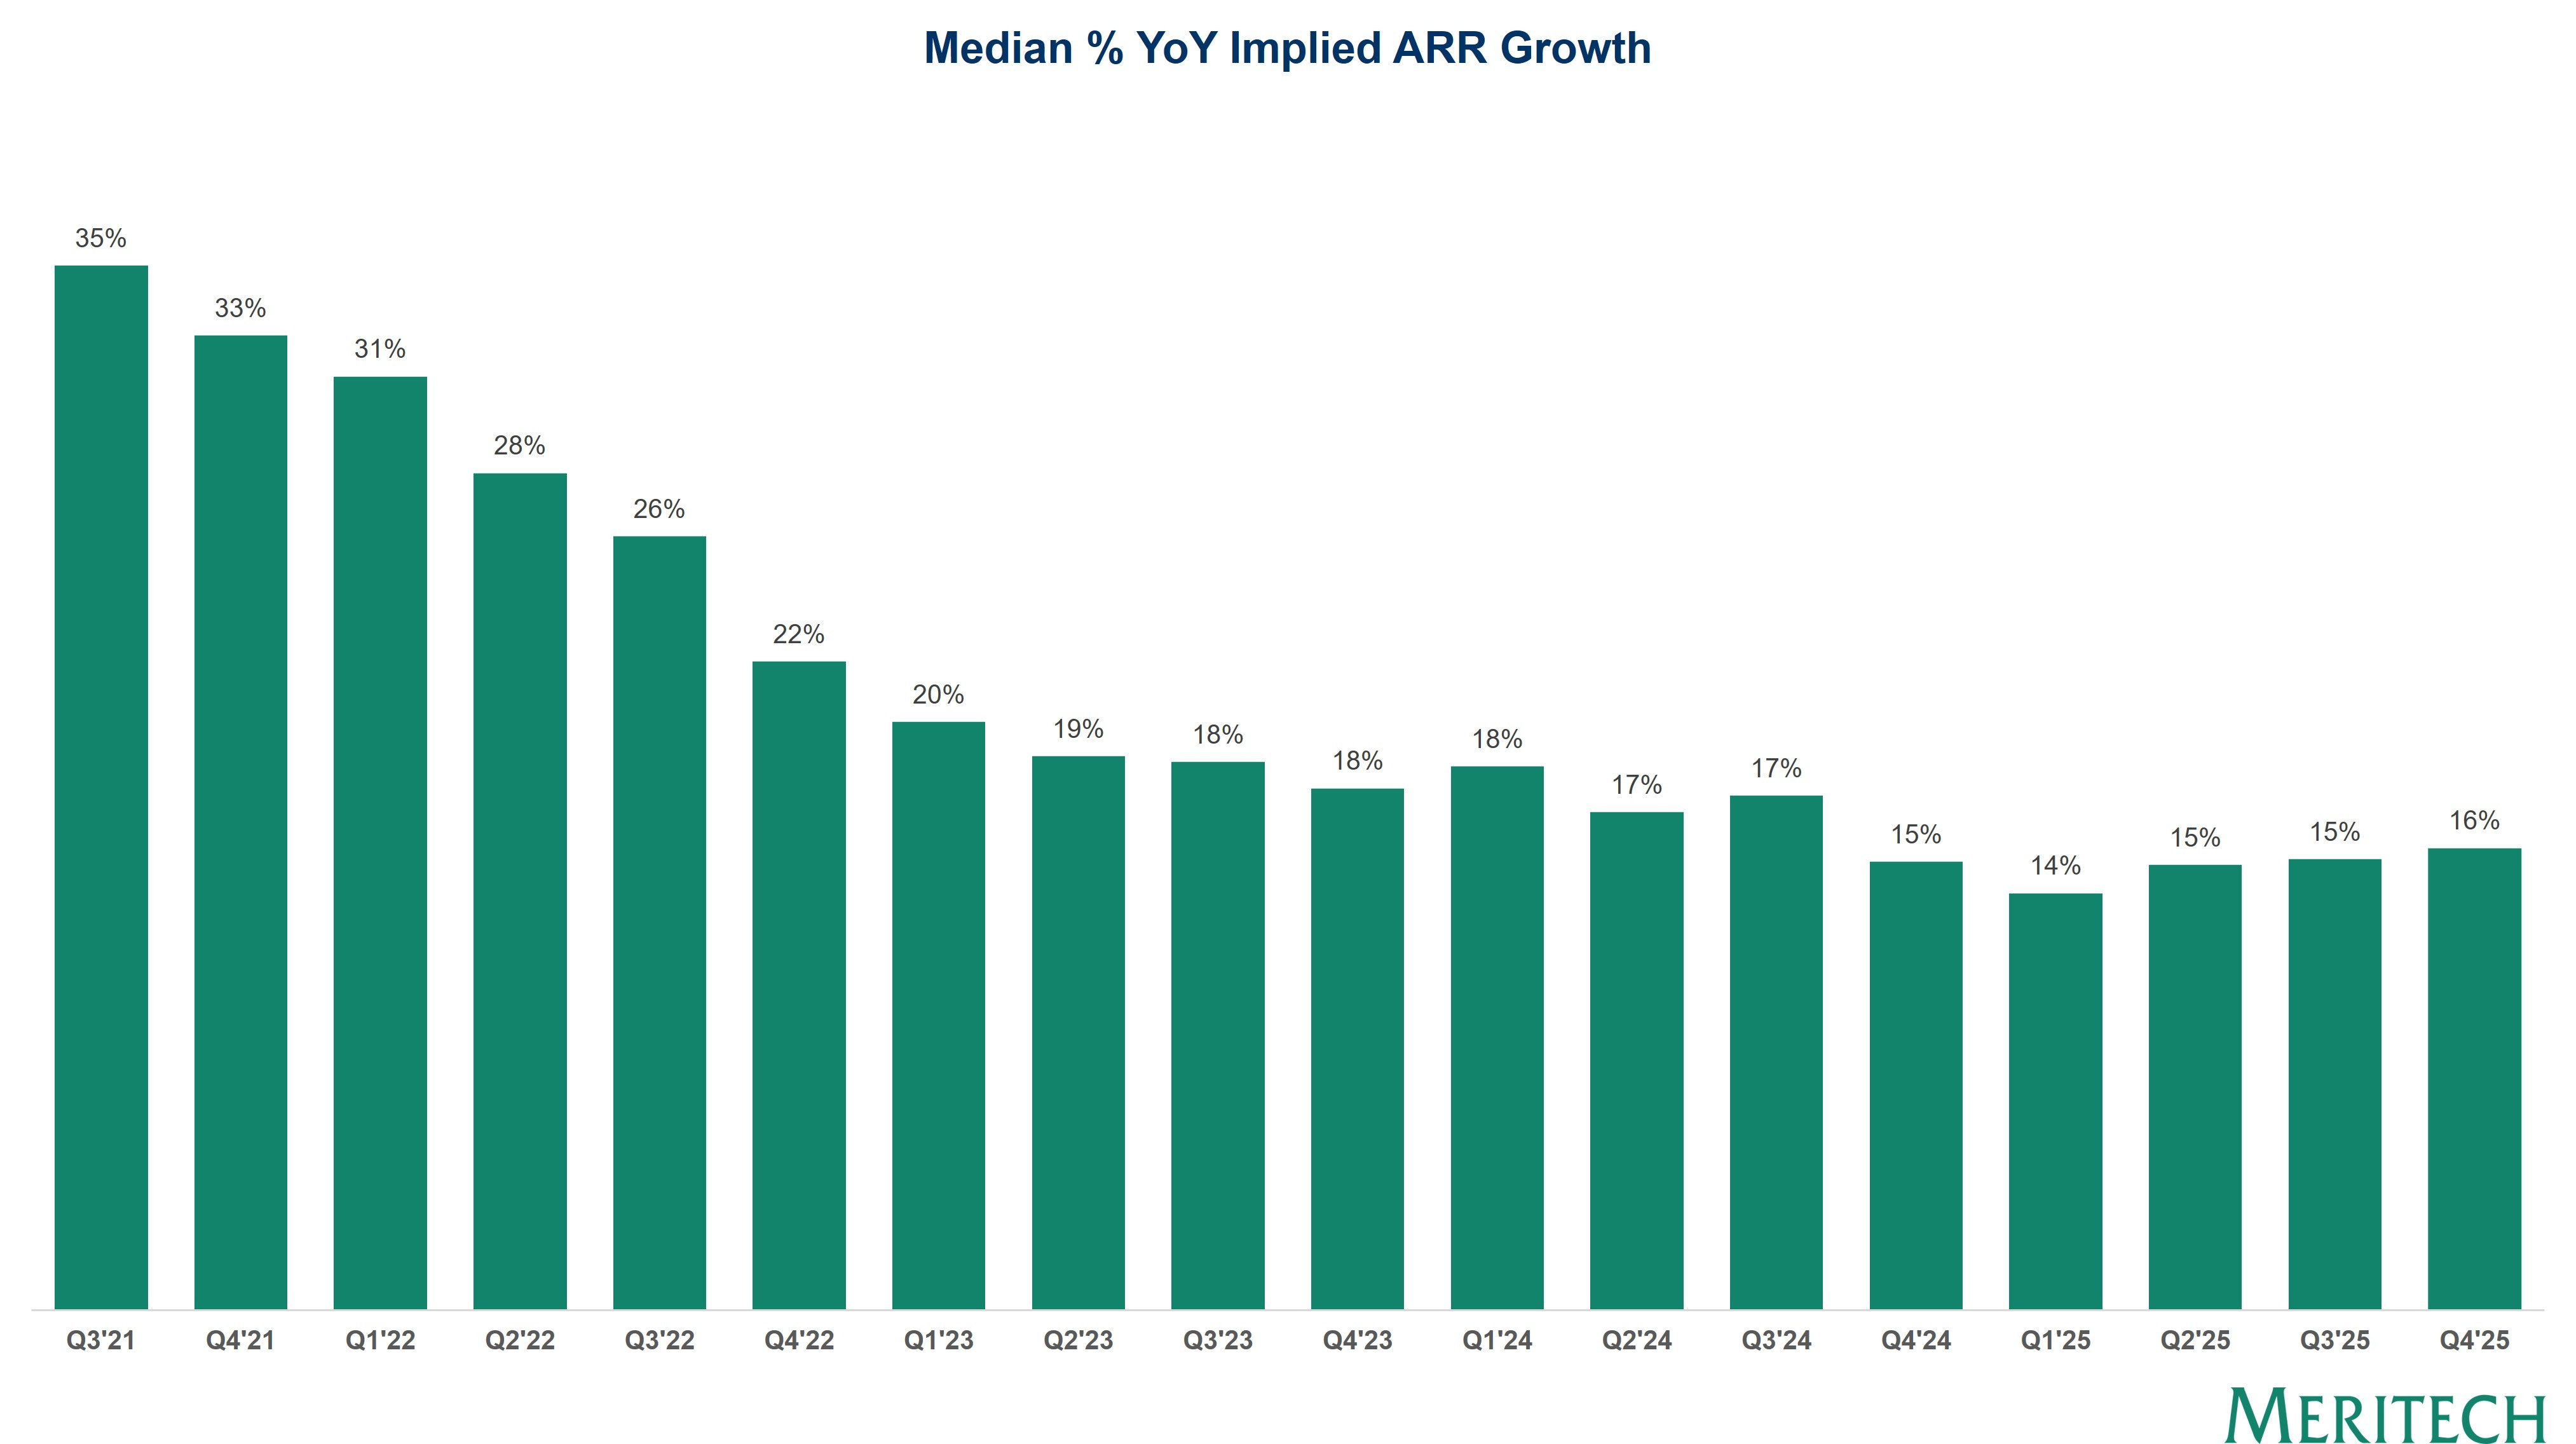
Source: Company Filings. Note: Implied ARR defined as quarterly total revenue multiplied by four. The majority of companies have reported Q4 results, but Q4 values are subject to change as the remaining companies file.
Median % YoY Customer Count Growth | All Software
Customer growth has slowed slightly over the last two quarters despite stable ARR growth.
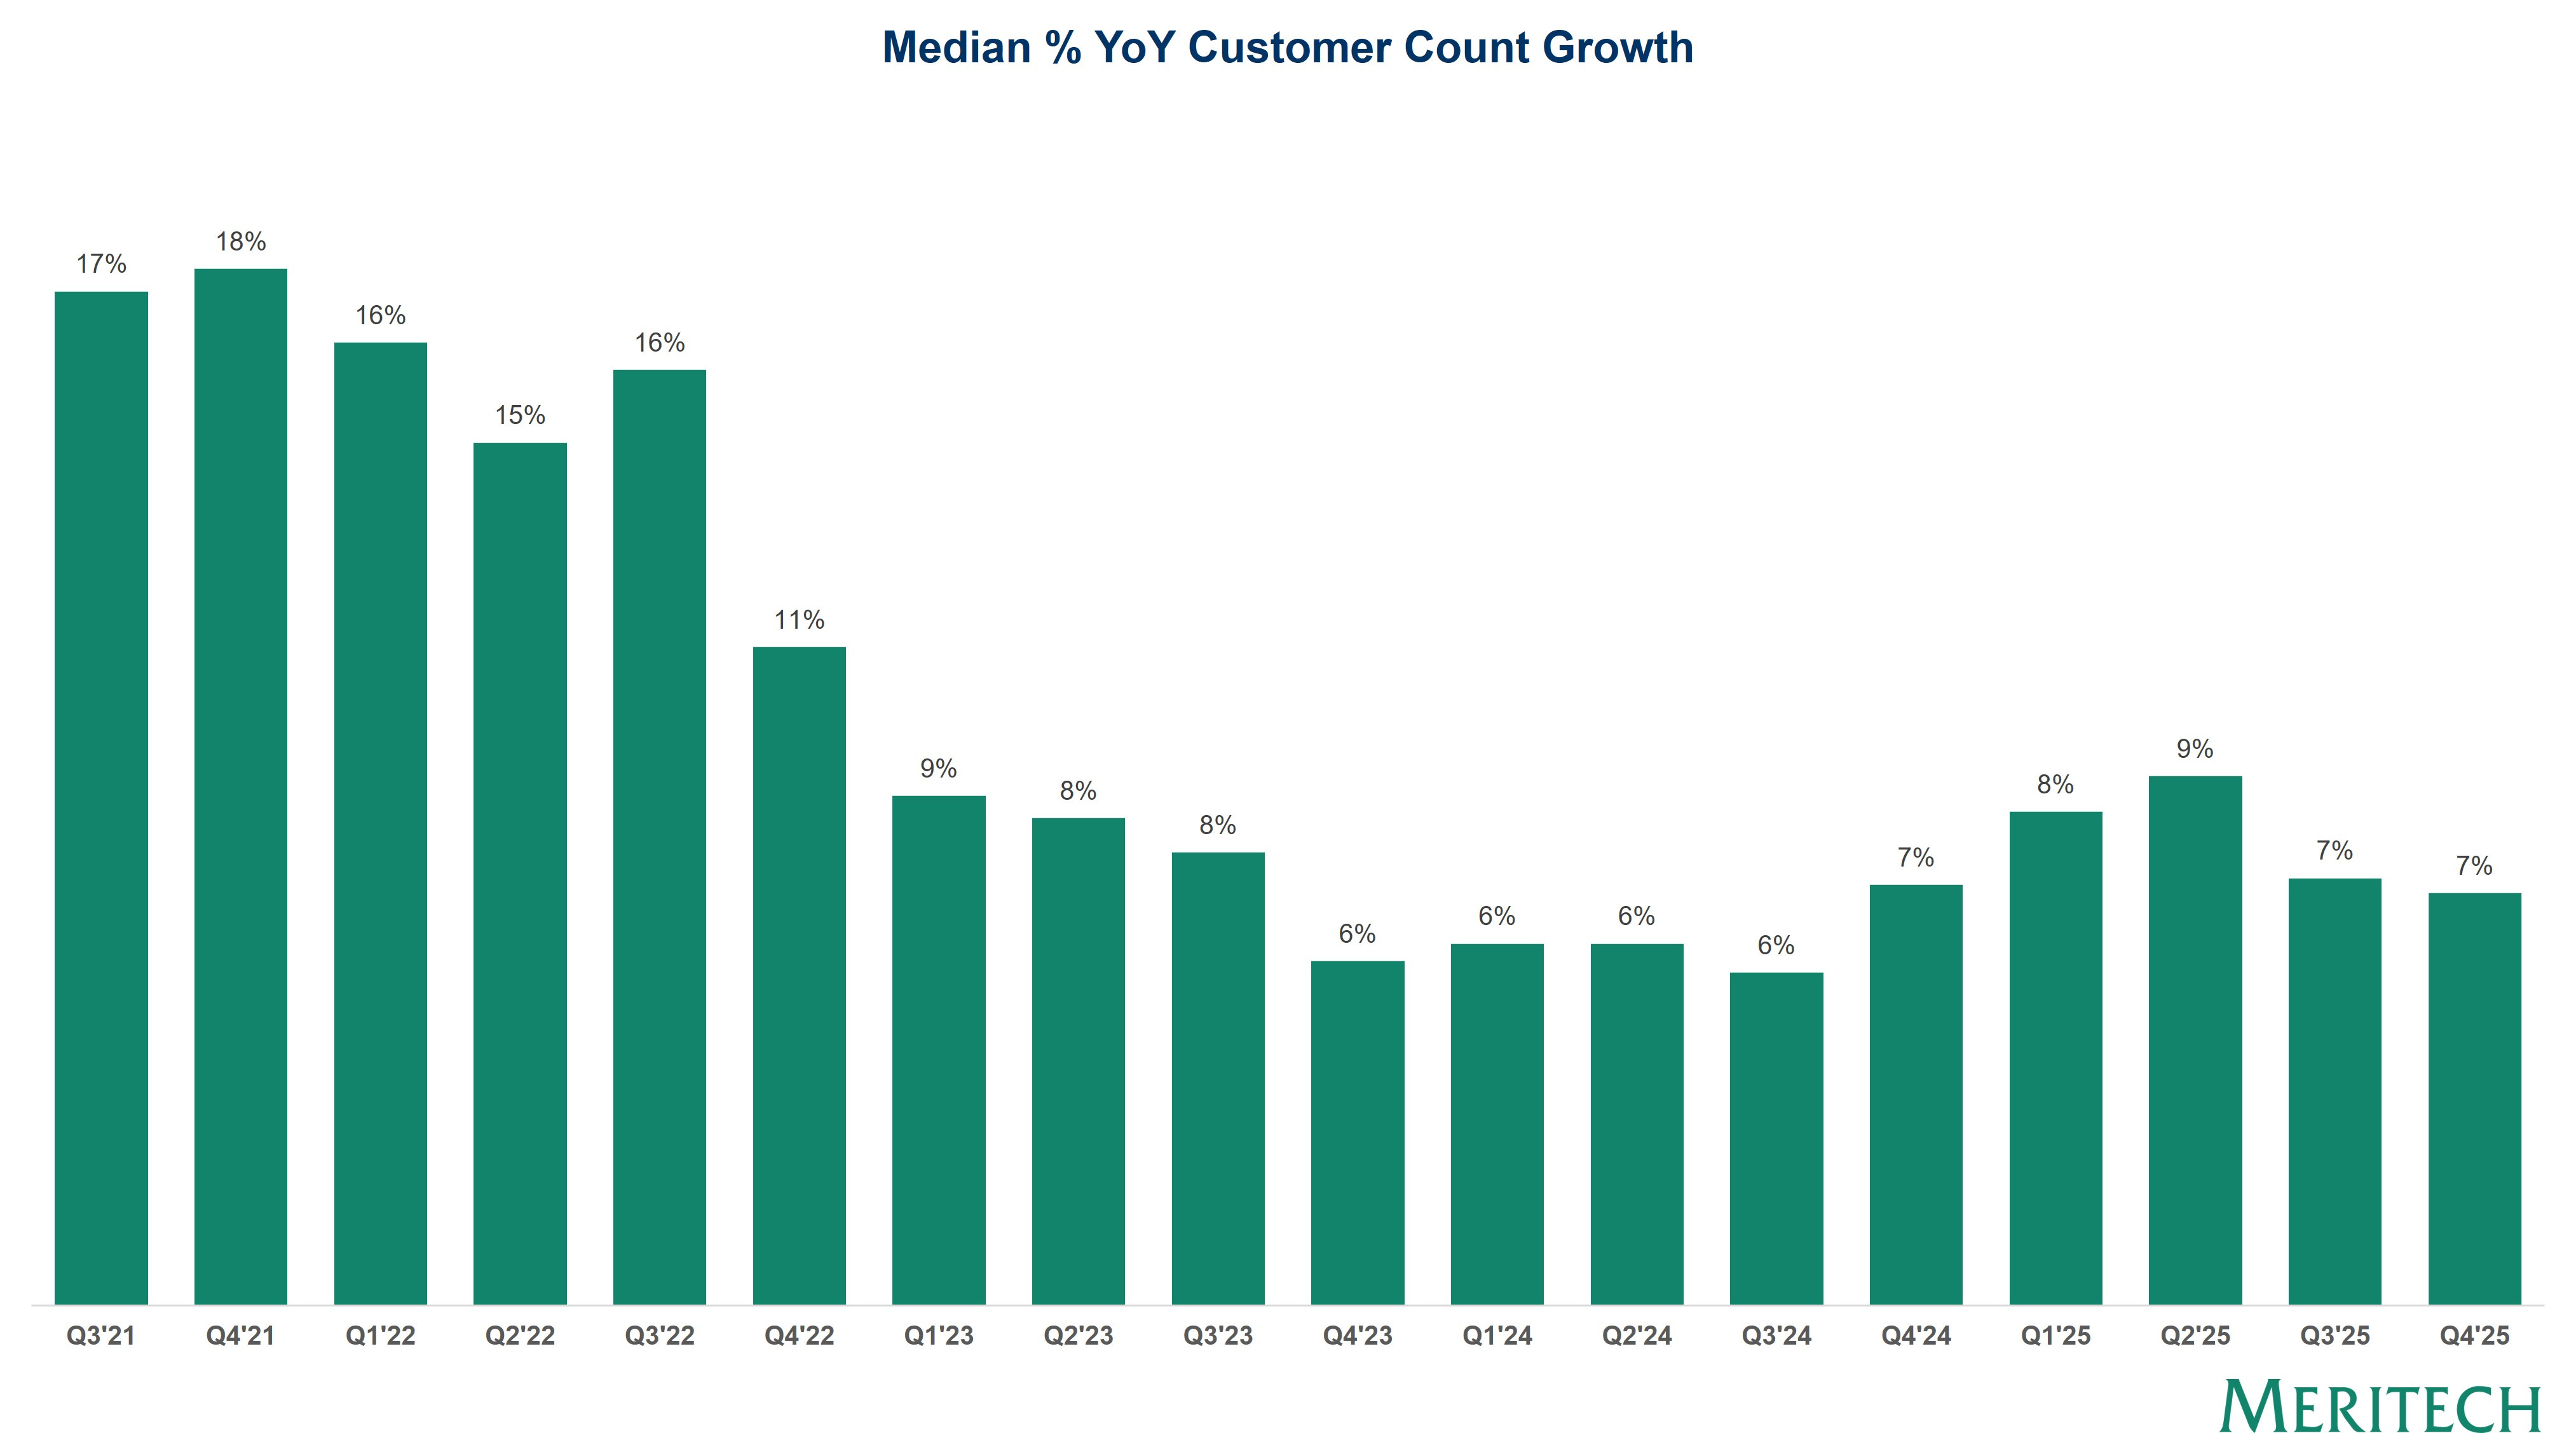
Source: Company Filings. The majority of companies have reported Q4 results, but Q4 values are subject to change as the remaining companies file.